This project is a demonstration showcasing the packaging of the Javascript mapping framework Leaflet into a QML/Qt application.
This is by no means a production-quality application, it is merely a kitbash of different Leaflet features to demonstrate what is possible with the framework.
I've also got a C++ implementation here: https://github.com/rhysbartholomaeus/leafletQt_CPP
- Built on Qt 5.12.9 MSVC 2017 64 Bit
If you want to have more than one layer style available:
- Java 8 or 11 JRE
- GeoServer (Tested with version 2.17.2)
Follow the instructions in the GeoServer Setup and GeoServer GeoTIFF Source sections to setup GeoServer for use with this example.
If you want to display ADS-B traffic on the map:
-
Python (Tested on 3.8.5)
- Python Flask
- Flask CORS
- Requests
Python requirements listed in requirements.txt file. To install the requirements, run: pip install -r .\requirements.txt inside the main directory.
Open the .PRO file in Qt Creator and build and run the project as per usual for Qt applications.
Note: Disable Shadow Building in the project settings.
Start the application in Qt Creator. The default map will load using the internet-provided OpenStreetMaps tile server.
The map has been setup to accept two WMS sources offered by a local instance of GeoServer. Refer to the GeoServer Setup section for advice. The application will still function if GeoServer is not present, however the two additional overlays present in the top right-hand corner of the application will be unavailable.
To create an overlay, select an appropriate shape on the left hand side tool bar and draw on the map. The unique Leaflet ID for the shape will appear in the 'Overlays' column on the left of the application.
To delete a shape, select the trashcan icon and select the desired shape(s) for deletion. Once finished, click the Save button to delete the overlay for good.
A Javascript drone has been built in that can be directed around the map. Note that this is not an accurate depiction of a drone by any means, it is merely a leaflet marker that can be moved around the map.
To use:
- Click on the 'Create Aircraft' button.
- Select any point on the map and the drone icon will appear.
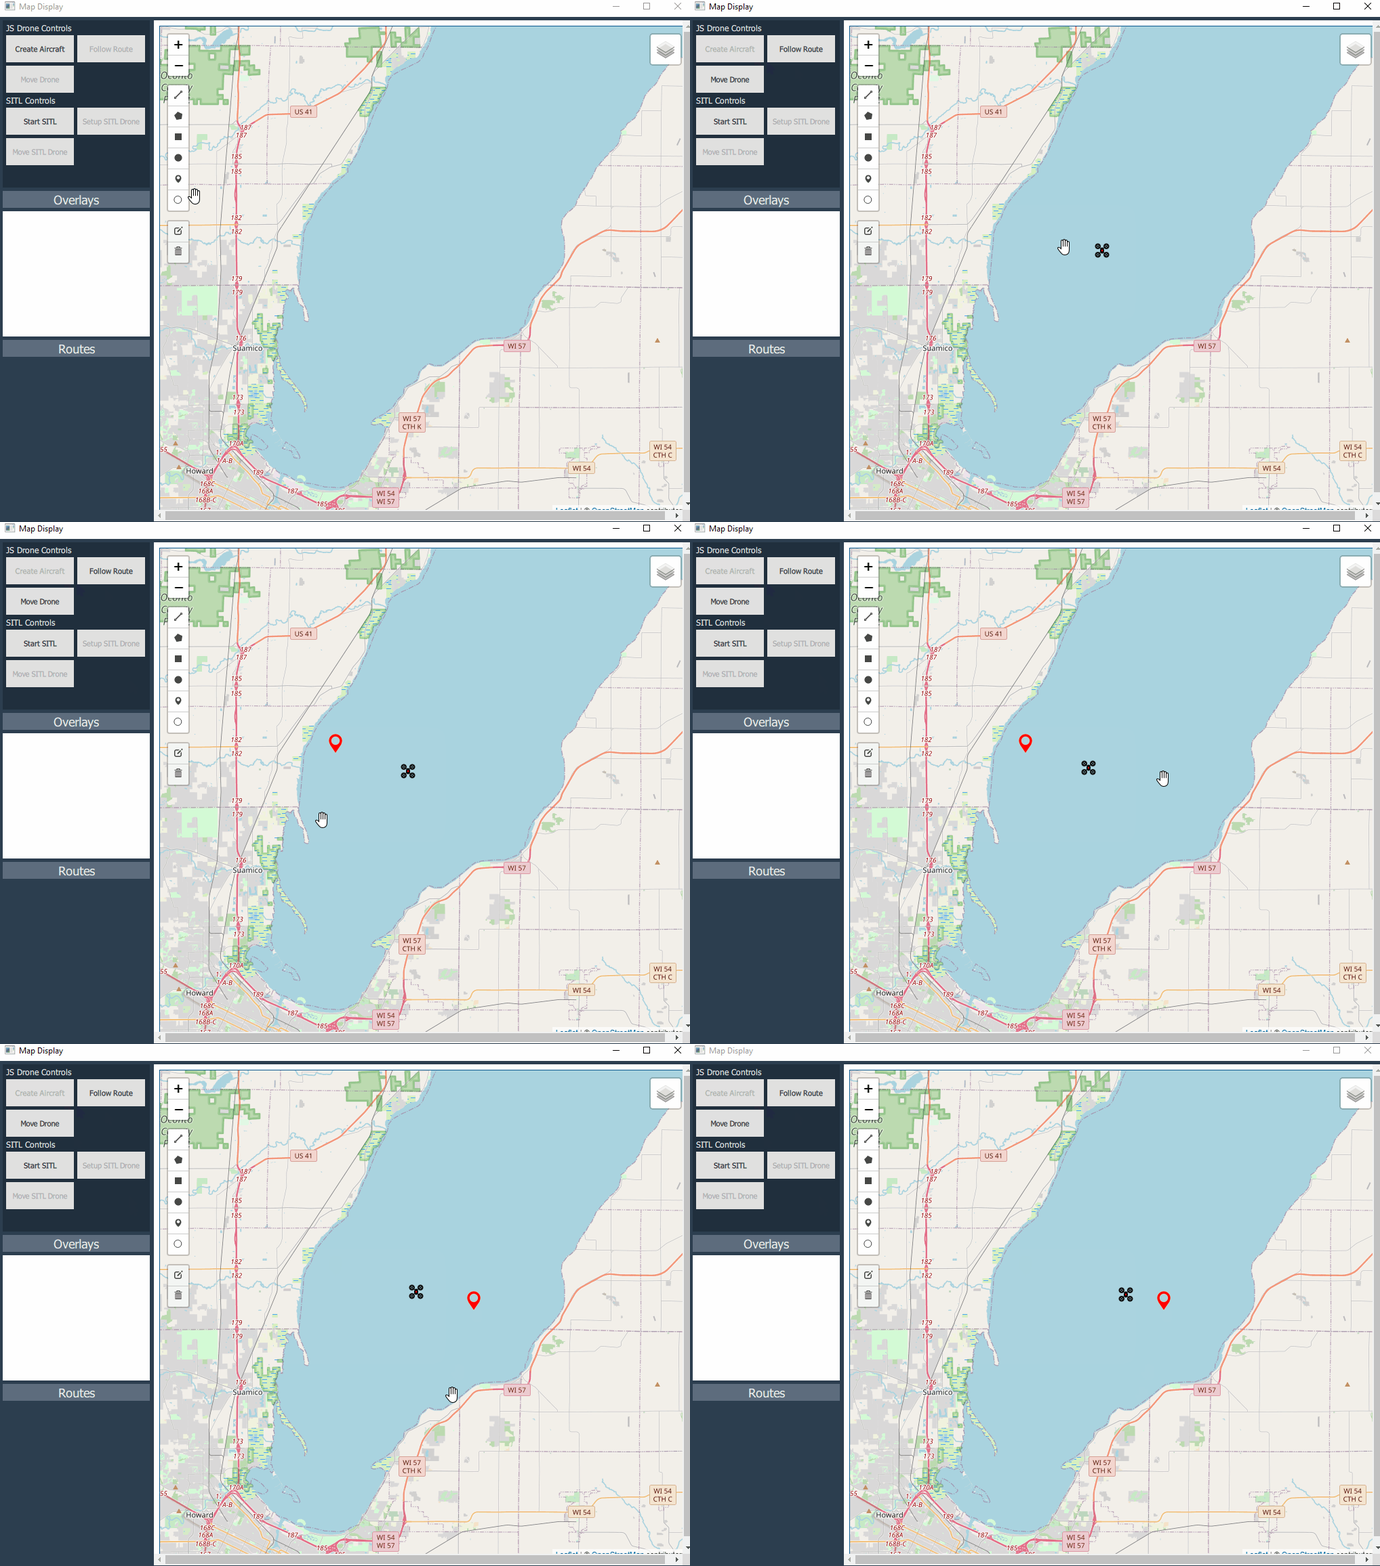
- Click 'Move Drone' and select a location on the map. A red waypoint symbol will appear and the drone will slowly make its way there.
- Optionally, create a polyline using the map drawing tools.
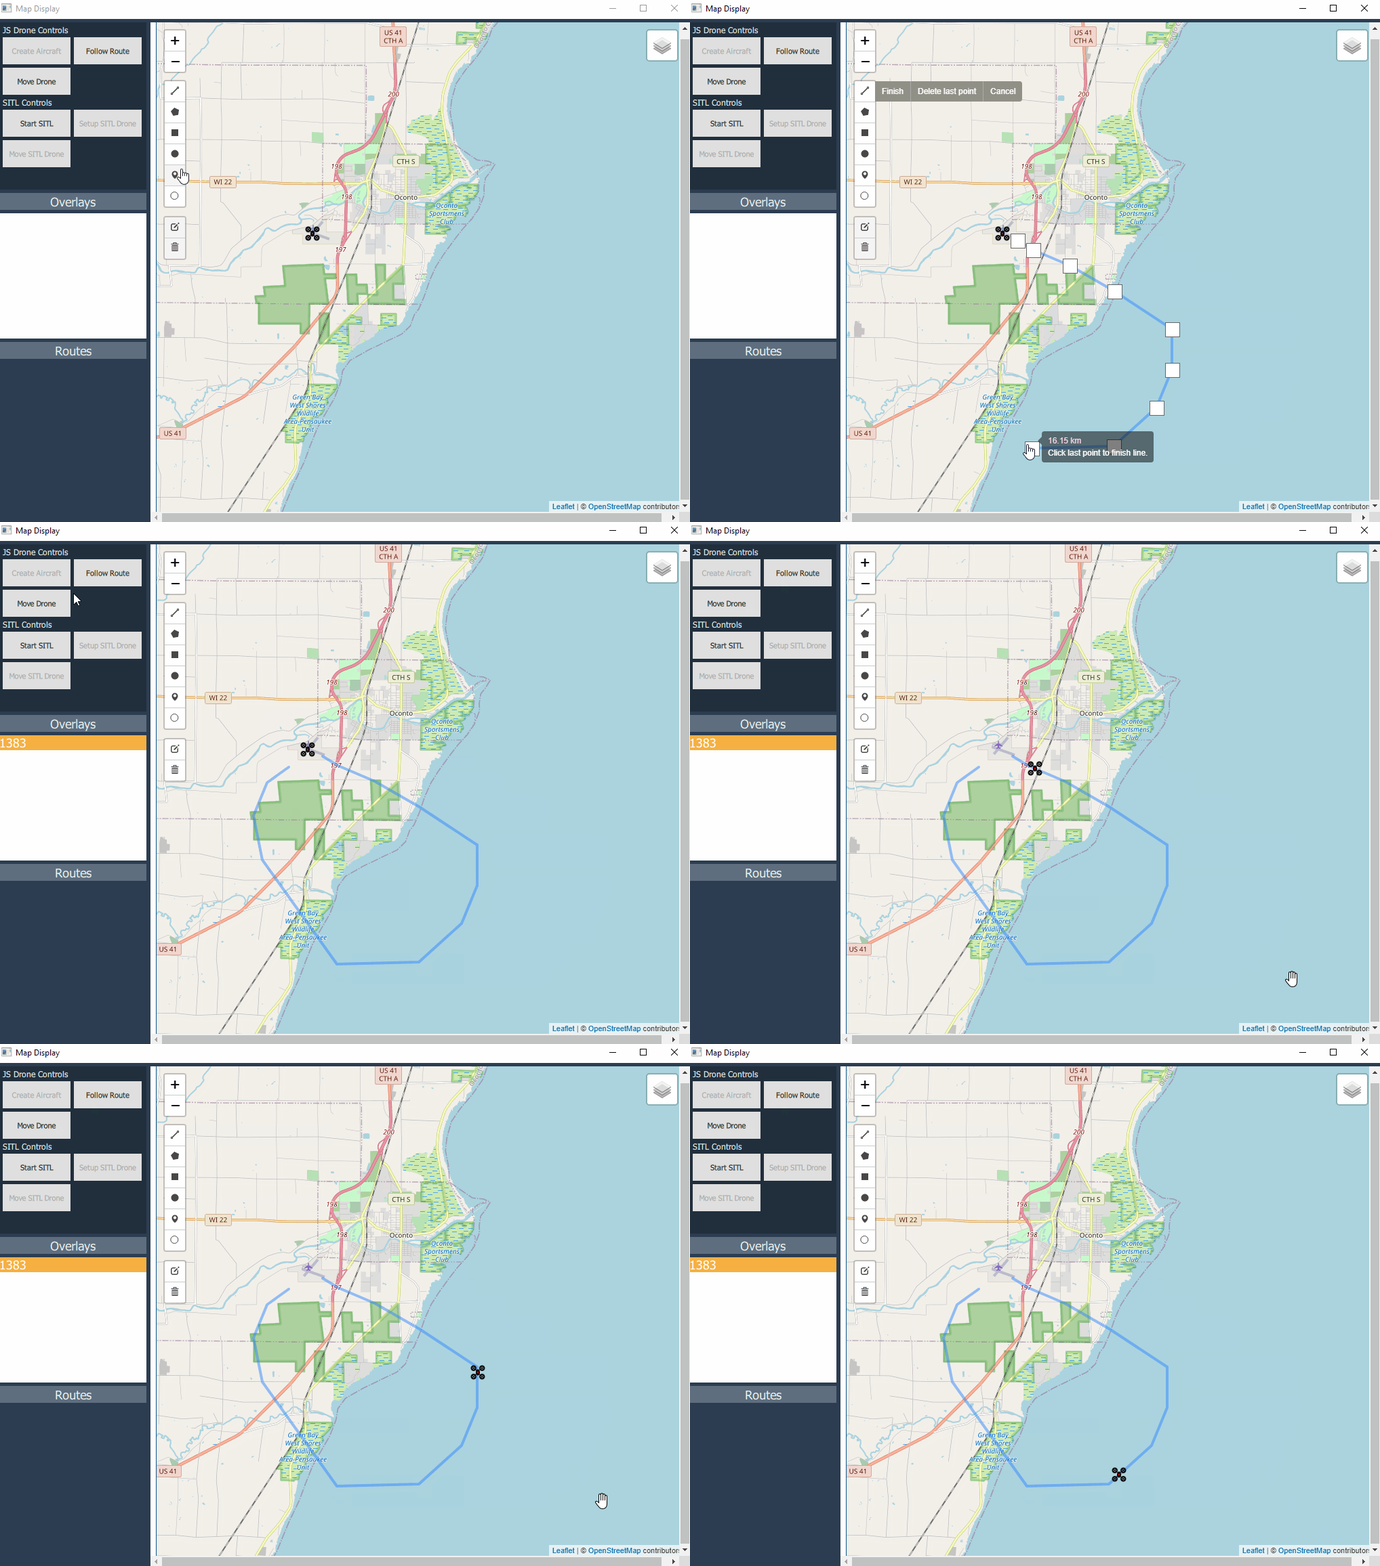
- Select the 'Follow Route' option and click on the layer-id for the polyline.
- The drone will follow the route. Be cautious how many times you click the 'Follow Route' option, since it will queue the commands for the drone, meaning that it may follow the target route many times over.
Go-to-location movement:
Follow route movement:
Note: This drone is nowhere near realistic at all. The movement speed is based on two things:
- The update rate for altering the position
- The 'speed' value for the aircraft.
To provide more consistent timings between waypoint legs, the drone is set to move at a speed of 15. This is an arbituary number and is not an SI unit.
If you reload the interior HTML page, you won't be able to create another drone.
Start GeoServer with a WMS service loaded. This provides an alternative map layer for viewing in the application.
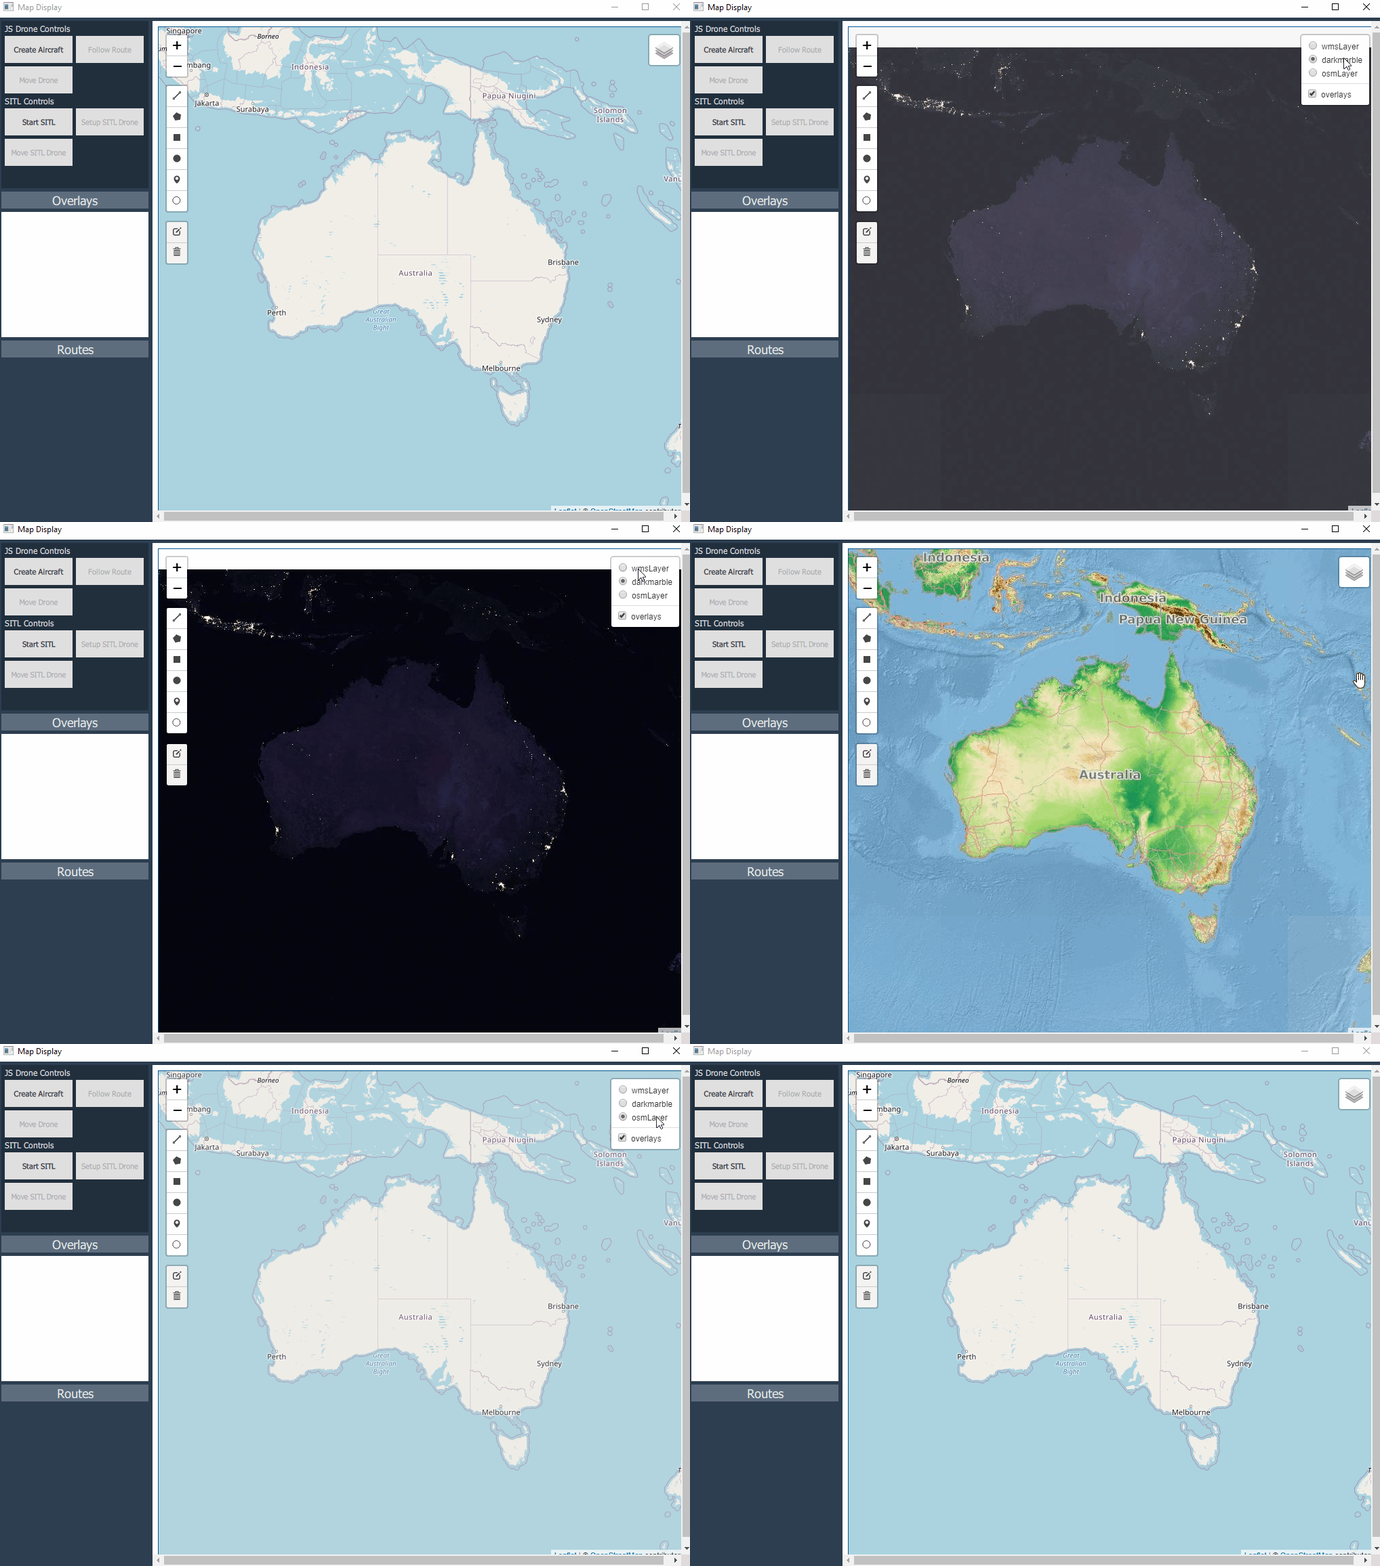
The GIF below demonstrates the internet-sourced OpenStreetMaps, DarkMarble sourced from a local instance of GeoServer and a cascading WMS instance of the Mundialis OSM topography tiles from a local instance of GeoServer.
Start flask in the source directory containing app.py using the following command:
flask run --port 5002
This provides real-world ADS-B traffic from the free-to-use OpenSky Network system. Free users can query once every 10 seconds for a live aircraft traffic update.
You might be wondering why it is necessary to run a Python server to obtain the data? The leaflet.realtime library that facilitates live data overlays on the leaflet map layer expects GeoJSON-formatted data. Unfortunately, by default, the OpenSky Networks does not provide the output data in the expected format.
While possible to deal with this data conversion using Javascript locally, it requires implementing your own async functionality. Not that this is a hard process, it's just a lot easier to run the data through a secondary service that outputs the format the leaflet.realtime library expects. (Since leaflet.realtime already implements its own async functionality)
Recently added Leaflet-Search to provide the ability to look for aircraft based in on their callsign. WARNING: This required modifying html/resources/leaflet-search/src/leaflet-search.js by adding the following to lines 627-633:
	// WARNING - This requires Leaflet.Realtime to be included in the project
	// There should be some sort of error checking or similar to verify the layer instance type
	// is available for comparison
	else if(layer instanceof L.Realtime)
    {
	   self._searchInLayer(layer._container, retRecords, propName);
	}
This is required as a Leaflet.Realtime layer embeds the FeatureGroup within the _container property, which ordinarily would be inaccessible to the Leaflet-Search plugin.
Functionality is limited, but users can instantiate a singular Ardupilot SITL Plane in a location of their choice, provided they have the flask server from here up and running.
Limited to creating the drone and setting an individual movement waypoint. The drone will move to the desired location and then return to its spawn location unless directed elsewhere.
- Start the flask server using
flask run --port 5005 - In the QML app, select 'Start SITL' and click anywhere on the map. This will spawn the drone on the ardupilot side, but GPS won't be active yet since it needs to calibrate. This takes between 10-20 seconds.
- Click 'Setup SITL Drone' in the QML app. This kicks off the periodic GeoJSON query for the drone. A track marker will appear where you clicked previously to spawn the drone.
- Wait for the drone to take off. This is automatic. The drone will reach a 100m altitude and begin to orbit the spawn location.
- Click 'Move SITL Drone' and select a location on the map. The drone will begin to move towards the semi-transparent waypoint marker. Once it reaches the target, it'll default back to Return To Launch mode and return home.
Leaflet was trialled with GeoServer to confirm that the framework can function with standard mapping formats. For the purposes of this demonstration, the system uses a cascading WMS service, reducing the need for the user to download gigabytes of map tile data.
The following steps were taken to establish a WMS service for Leaflet to consume:
-
Download GeoServer from http://geoserver.org/
-
Ensure that Java bin directory is on the system PATH
- Run
java --versionfrom the command line to confirm
- Run
-
From the GeoServer bin directory, run
startup.bat -
Using a webbrowser, navigate to
http://localhost:8080/geoserver/web/- Sign in using username:
admin - and password:
geoserver
- Sign in using username:
-
Navigate to the Workspaces folder using the left-hand navigation pane.
-
Click the select all checkbox, then click the 'Remove selected workspace(s)' button and click OK.
-
Cascading WMS services use a remote hosted service instead of requiring the user to download gigabytes of data. This example uses the WMS source from: http://ows.mundialis.de
-
The following outlines how to create a cascading WMS source:
- In GeoServer, select the Workspaces -> Add new workspace
- Set the name and a URI (The URI will be used in the URL for the WMS service). In this example, use the string
map_serverfor both the name and URI fields. - In the Edit Workspace page, tick the Enabled checkbox.
- Click Stores -> Add new store. In the 'New data source' page, select the WMS option under 'Other Data Sources'
- Select the appropriate workspace and provide a WMS Source Name, in this instance use
Mundialis - In the capabilities URL, paste in the URL from your WMS service, use:
http://ows.mundialis.de/services/service?for the Mundialis WMS service. - Click Save.
- The next page displays the available WMS services offered from the capabilities URL. Select the
TOPO-OSM-WMSservice and click 'Publish' - On the next page, scroll to the bottom and click 'Save' (By default the data will be enabled for use.)
- Test the service by clicking Layer Preview -> OpenLayers (Under 'Common Formats')
-
In your HTML page or similar, use the following Javascript snippet to create a map using the MS service:
var mymap = L.map('mapid').setView([0, 0], 5);

var wmsLayer = L.tileLayer.wms('http://localhost:8080/geoserver/map_server/wms?', {
    layers: 'TOPO-WMS'
}).addTo(map);

L.control.layers({
        "wmsLayer": wmsLayer.addTo(map),
    }).addTo(map);
This creates a tilelayer pointed to your local instance of the WMS service. Note: This assumes that you have imported the necessary Javascript / CSS files for Leaflet. For more details, refer to Leaflet getting started guide.
More information on cascading WMS services can be found here.
- Obtain a GeoTIF source, the following was used: https://earthobservatory.nasa.gov/features/NightLights/page3.php
- Create a directory in the GeoServer data_dir directory, IE:
geoserver/data_dir/data/YOURDATAand place the .tiff file(s) in there. - Start and open GeoServer.
- Click Stores -> Add new Store
- Use the following Data Source Name:
BlackMarble_2016_D2_geo - Browse for the newly copied .tiff file under the Connection Parameters.
- On the New Layer page, click Publish
- Check the coordinate reference system is consitent with the captured imagery (IE: EPSG 4326)
- Open the Publishing tab. Verify under Root Layer Capabilities that WMS Global Settings are selected.
- Click Save
- Update your map to include the WMS layer using your GeoTIFF raster image, IE:
    var darkmarble = L.tileLayer.wms('http://localhost:8080/geoserver/map_server/wms?', {
        layers: 'BlackMarble_2016_D2_geo'
    });
Don't forget to add a control as well:
    // Only add a single layer to the map, otherwise all will draw simultaneously.
    var tileLayers = {
        "Topographic OSM": wmsLayer,
        "Dark Marble": darkmarble,
        "Open Street Map": osm.addTo(map)
    }

    L.control.layers({
        tileLayers
}).addTo(map);Communication between the Javascript running on the HTML page and the host QML application can be achieved via the following.
In QML, create a Qt object or similar:
QtObject{
    id: pageChannel
    WebChannel.id: "qmlLeaflet"

    property string systemId: "QML334524"

    signal logString(string message)

    function someMethod(idValue){
        // Do something
    }
}

WebEngineView {
    url: "qrc:/index.html"
    webChannel: channel
}

WebChannel {
    id: channel
    registeredObjects: [pageChannel]
}
This creates a QtObject that can be accessed via Javascript running on the HTML page.
On the HTML page, create the script following:
<script type="text/javascript" src="qrc:///qtwebchannel/qwebchannel.js"></script>

<script>
    var qmlLeaflet;

    window.onload = function()
    {
        // Set up the QWebChannel for bi-directional comms with the host QML application.
        new QWebChannel(qt.webChannelTransport, function(channel) {
            qmlLeaflet = channel.objects.qmlLeaflet;

            // connect to a signal
            qmlLeaflet.logString.connect(function(someText) {
                console.log("Got signal: " + someText);
            });
        });
    }

    // Demonstration for getting/setting remote QtObject properties
    function getPropertyValue()
    {
        var value = qmlLeaflet.systemId;

        console.log(qmlLeaflet.systemId);
        qmlLeaflet.systemId = "RTX3090";
        console.log(qmlLeaflet.systemId);

        qmlLeaflet.systemId = value;
    }
</script>
All calls are done a synchronously through the WebChannel module.
Similar to QML, connection through C++ is as simple as:
#ifndef JSOBJ_H
#define JSOBJ_H

#include <QObject>
#include <QDebug>

class jsobj : public QObject
{
    Q_OBJECT
public:
    jsobj();

public slots:
    Q_INVOKABLE void log(const QString &str);
    Q_INVOKABLE void shapeAdded(const QString &str);

signals:
    Q_INVOKABLE void routeAdded(const QString &routeId);

};

#endif // JSOBJ_H
#include "include/jsobj.h"

jsobj::jsobj()
{

}

void jsobj::log(const QString &str){
    qDebug() << "GOT STR: " << str ;
}

void jsobj::shapeAdded(const QString &str){
    qDebug() << "Got shape ID: " << str;
    emit jsobj::routeAdded(str);
}
Then in your primary Qt application class:
// Warning - Demonstration - Not all code present.
MainWindow::MainWindow(QWidget *parent)
    : QMainWindow(parent)
    , ui(new Ui::MainWindow)
{
    ui->setupUi(this);

    m_view = new QWebEngineView(ui->mapDisplay);

    QWebChannel *channel = new QWebChannel();
    jsobj *js = new jsobj();
    m_view->page()->setWebChannel(channel);
    channel->registerObject(QString("JsInterface"), js);

    m_view->page()->load(QUrl("file:///./html/index.html"));

    connect(m_view, &QWebEngineView::loadFinished, this, &MainWindow::handleOnLoad);
    connect(ui->clearAllTracks, SIGNAL (released()), this, SLOT (handleClearAllTracks()));
    connect(ui->trackQueryInit, SIGNAL (released()), this, SLOT (handleStartTrackQuery()));
    connect(js, &jsobj::routeAdded, this, &MainWindow::updateList);
    connect(ui->spawnPlane, SIGNAL (released()), this, SLOT (handleSpawnPlane()));
}
// Warning - Demonstration - Not all code present.
To run Javascript from the WebEngine, use the WebEngineView object (m_view in this instance):
// Warning - Demonstration - Not all code present.
void MainWindow::handleStartTrackQuery(){
    qDebug() << "Commencing track query.";
    m_view->page()->runJavaScript("initiateTrackQuery(trackLayer);");
}
// Warning - Demonstration - Not all code present.
Invoking C++ from Javascript is identical to that in QML:
new QWebChannel(qt.webChannelTransport,
function(channel){
    var webobj = channel.objects.JsInterface;
    webobj.shapeAdded('Message');
});To faclitate several different functions, the following Leaflet addon modules were used:
- Leaflet Draw
- Leaflet Realtime
- Leaflet Moving Marker
- Leaflet Track Symbol
Leaflet Draw provides the ability to add overlays to the map, using a separate feature layer that is superimposed over the map.
Each overlay (Polygon, line, square, circle, marker) has a unique leaflet ID associated with it (In the form of a varying digit number. Complicated shapes typically have larger ID values than simple markers or lines). It would be trivial to store the overlay IDs inside a map, with the ID acting as a key and other attributes present inside. This would allow for overlay names and other metadata to be assigned to the shape with relative ease. Retreiving the overlay ID is conducted through the JS WebChannel, allowing bi-drectional communication between the QML (Or C++) application. In this instace, the IDs are stored in a singleton QML ListModel.
Overlays are not persistent nor are they shared, so this mechanism would need to be introduced in the future if this functionality were desired.
Leaflet Realtime provides a means of drawing GeoJSON data on the map at a set, fixed rate. The data retrieval is not 'realtime', in that it relies on asynchronous fetch (GET requests) to obtain the data. A consequence of this is that the Realtime addon is reliant on GeoJSON data, requiring items to be converted first before being displayed. This was the case with the OpenSky Network Python server, which provides GeoJSON datatypes for ADS-B traffic.
Leaflet realtime typically takes in a URL for requests, however the Realtime addon can also use a function in place of a URL, IE:
L.realtime({
        function(success, error){
            var flightData = httpGet('https://opensky-network.org/api/states/all').then(function(result){return result});
            success(flightData);
    }
In this example, httpGet was a test function which queried the URL, performed the necessary JSON to GeoJSON conversion of the data and returned the response. The realtime success function then takes in the data and projects this onto the map for each of the feature objects present in the GeoJSON feature set.
The function is expected to return straight away, so if performing a fetch, it is necessary to write your own asynchronous logic to handle the delayed promise return. As such, it was just as simple to use a Python server to handle this.
Ever wanted to move a maker around the screen? This addon lets you do it. This allows you to send multiple points to an existing marker and make it follow each point. For the purposes of demonstration, the points are pulled from a route created using the Leaflet Draw addon.
Unfortuantely, this addon creates a moving marker using a timer for the entire journey or for each leg of the trip. This means that markers that are spawned to follow a route are moving based on time allocated for the journey/leg, rather than a speed. Additionally, markers will snap to the first point, rather than transition to them.
Note that the Moving Marker library only supports Polylines. Other polygons (squares, rectangles, circles, etc) are not supported due to differences in how the point data is stored for those shapes.
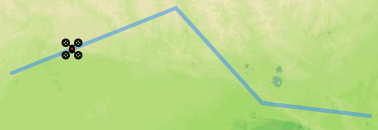
Below is a custom icon attached to a moving marker, following the designated route:
I also trialled attaching an Ardupilot Software in the Loop simulated drone and the Python DroneKit library to the Leaflet marker display. This was a separate flask server that allows a user to spin up a Ardupilot drone and retrieve it's position. Commands were going to be added to allow the user to manually direct the drone around the map.
Currently it is possible to instantiate a SITL Drone and direct it to a location.
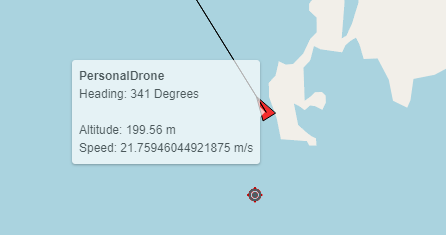
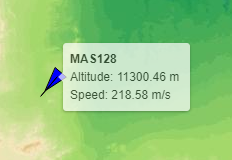
This addon provides the ability to replace the standard marker icon with a marker that showcases the heading and speed of the data in question.
Tool-tip bindings can be added to showcase specific details for a track. Note that each layer is automatically updated when data changes, reducing the overhead required for the implementing programmer.
Binding the tooltip to the track data:
    pointToLayer: function(feature, latlng) {
        // style the aeroplane loction markers with L.DivIcons
        var marker = L.trackSymbol(latlng, {
        trackId: feature.id,
        fill: true,
        fillColor: '#0000ff',
        fillOpacity: 1.0,
        stroke: true,
        color: '#000000',
        opacity: 1.0,
        weight: 1.0,
        speed: feature.properties['velocity'],
        course: feature.properties['true_track'],
        heading: feature.properties['true_track']
    }).bindTooltip(
            '<b>'+ feature.properties['callsign']
                +'</b><br>Altitude: '+ feature.properties['geo_altitude'] +' m <br>'
                + 'Speed: ' + feature.properties['velocity'] + ' m/s',
            {
                permanent: false, opacity: 0.7}
        );
        return marker;
    }
    }).addTo(trackLayer);
Full code can be found in the html/resources/leaflet.realtime/QueryOpenSkyNetworks.js file.

