SVGChart is a library to create simple charts on Xamarin.Forms using a SVG file and SkiaSharp to display it.
You could clone this repository or simply add the NuGet package https://www.nuget.org/packages/SVGChart.Nuget
Just add the package reference and chart view.
 xmlns:svgChart="clr-namespace:SVGChart.Nuget.Views;assembly=SVGChart.Nuget"

 <svgChart:VerticalBarChartView
                BarWidth="Medium"
                DisplayValue="False"
                HeightRequest="450"
                ItemSource="{Binding ChartValues}"
WidthRequest="450" />- HorizontalBarChartView
- DonutChartView
- VerticalBarChartView
- LineChartView
-
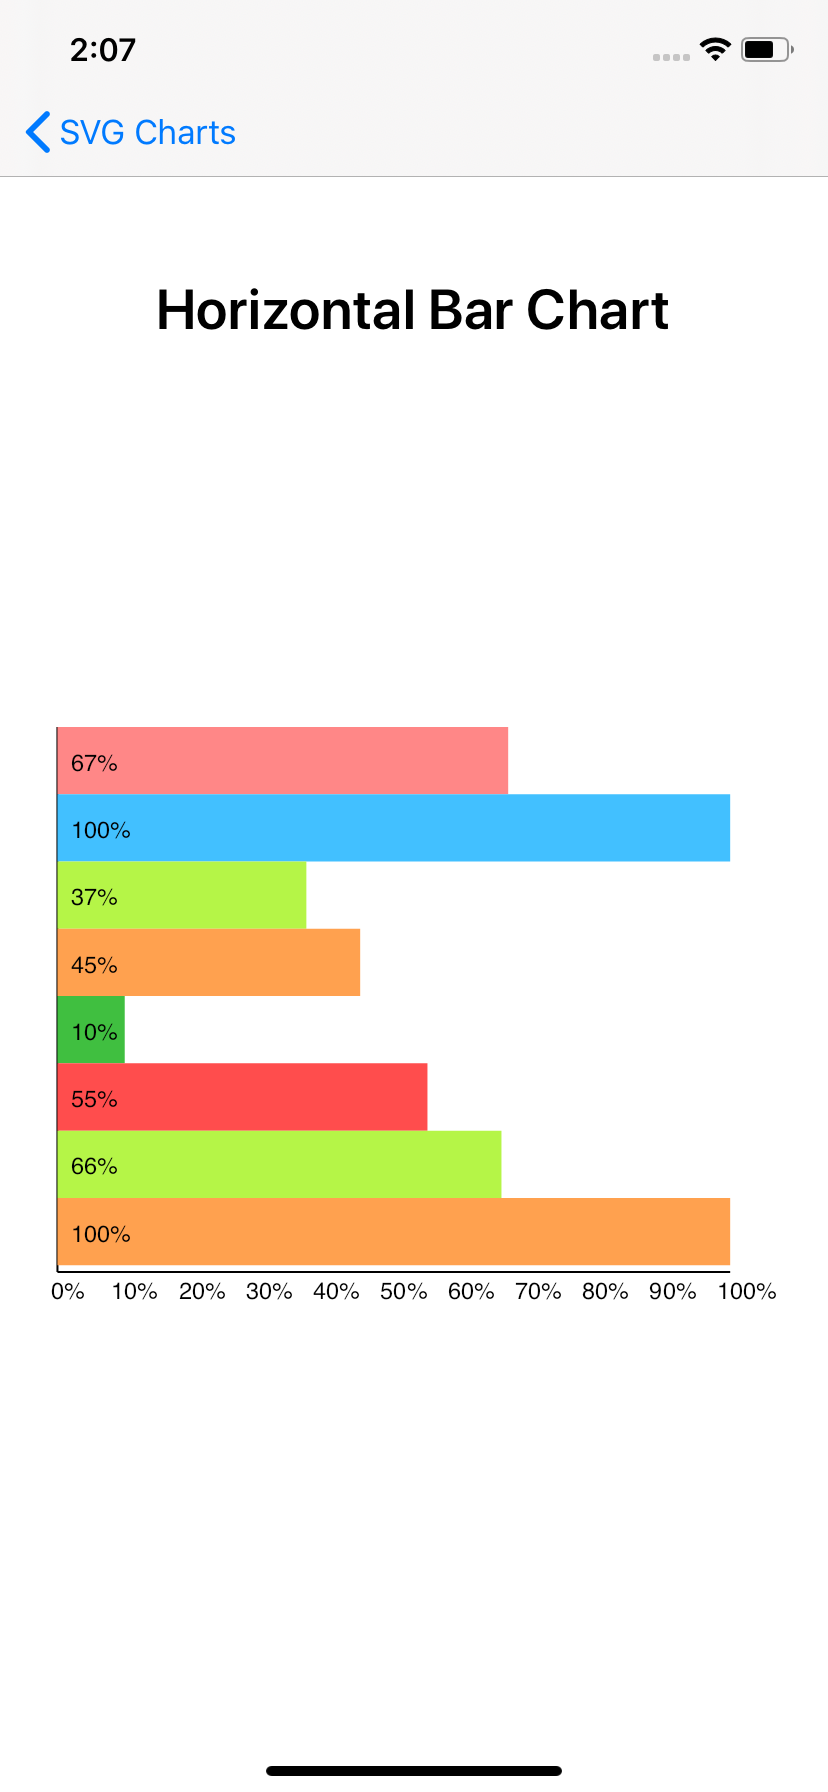
Horizontal Bar Chart.
- DisplayValues
- BarHeight
-
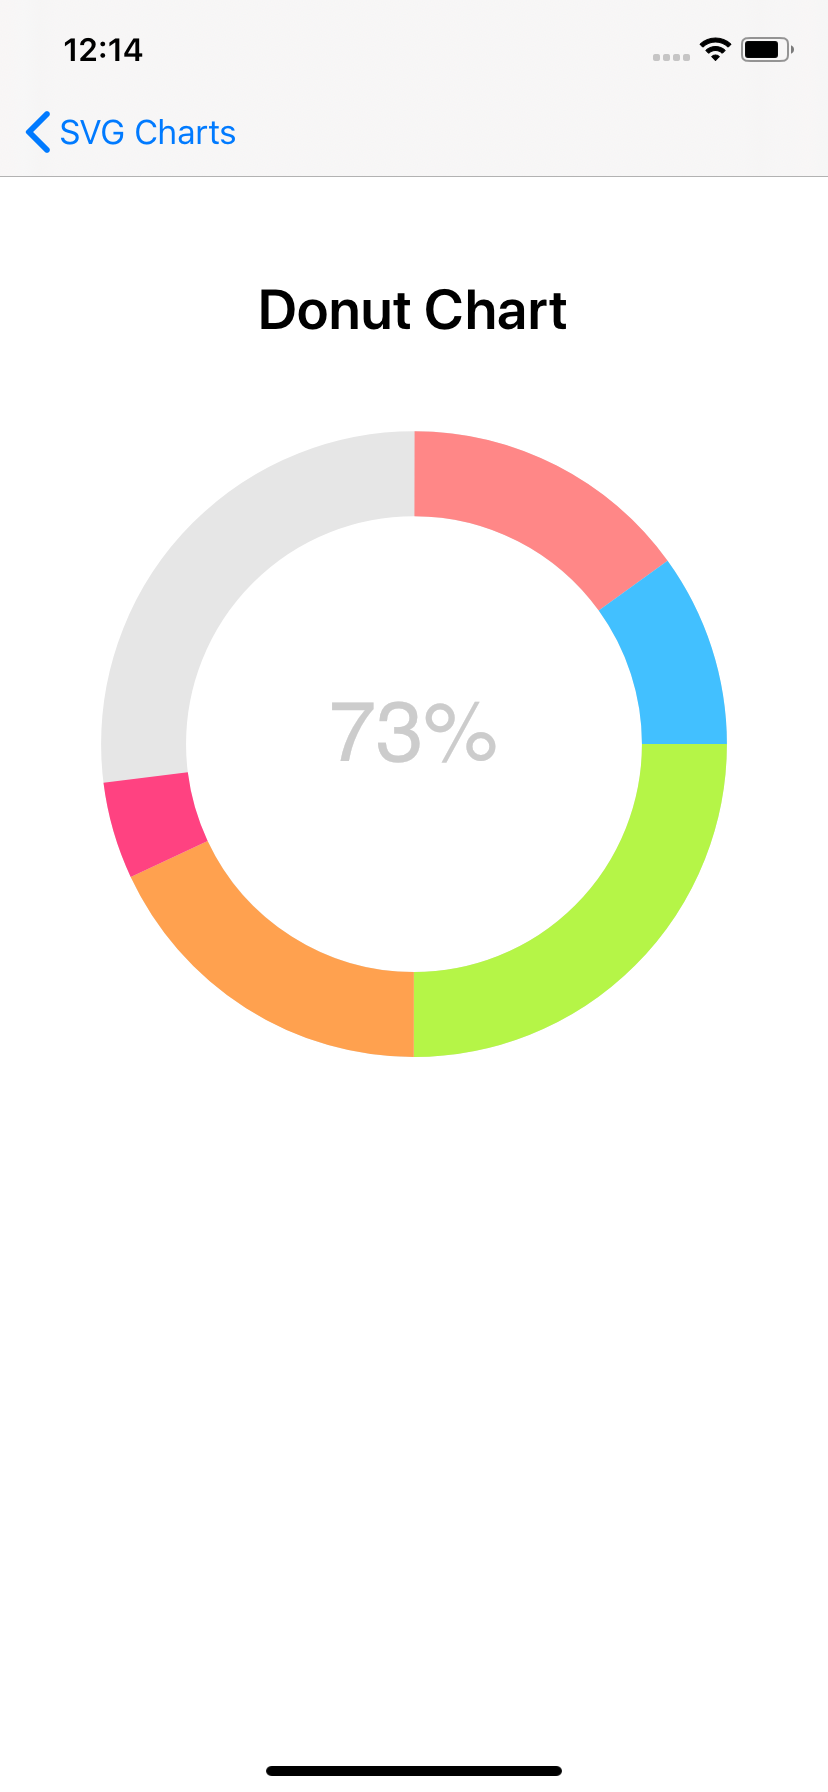
Donut Chart.
- RingColor
- FillColor
- TitleColor
- ChartTitle
- StrokeWidth
-
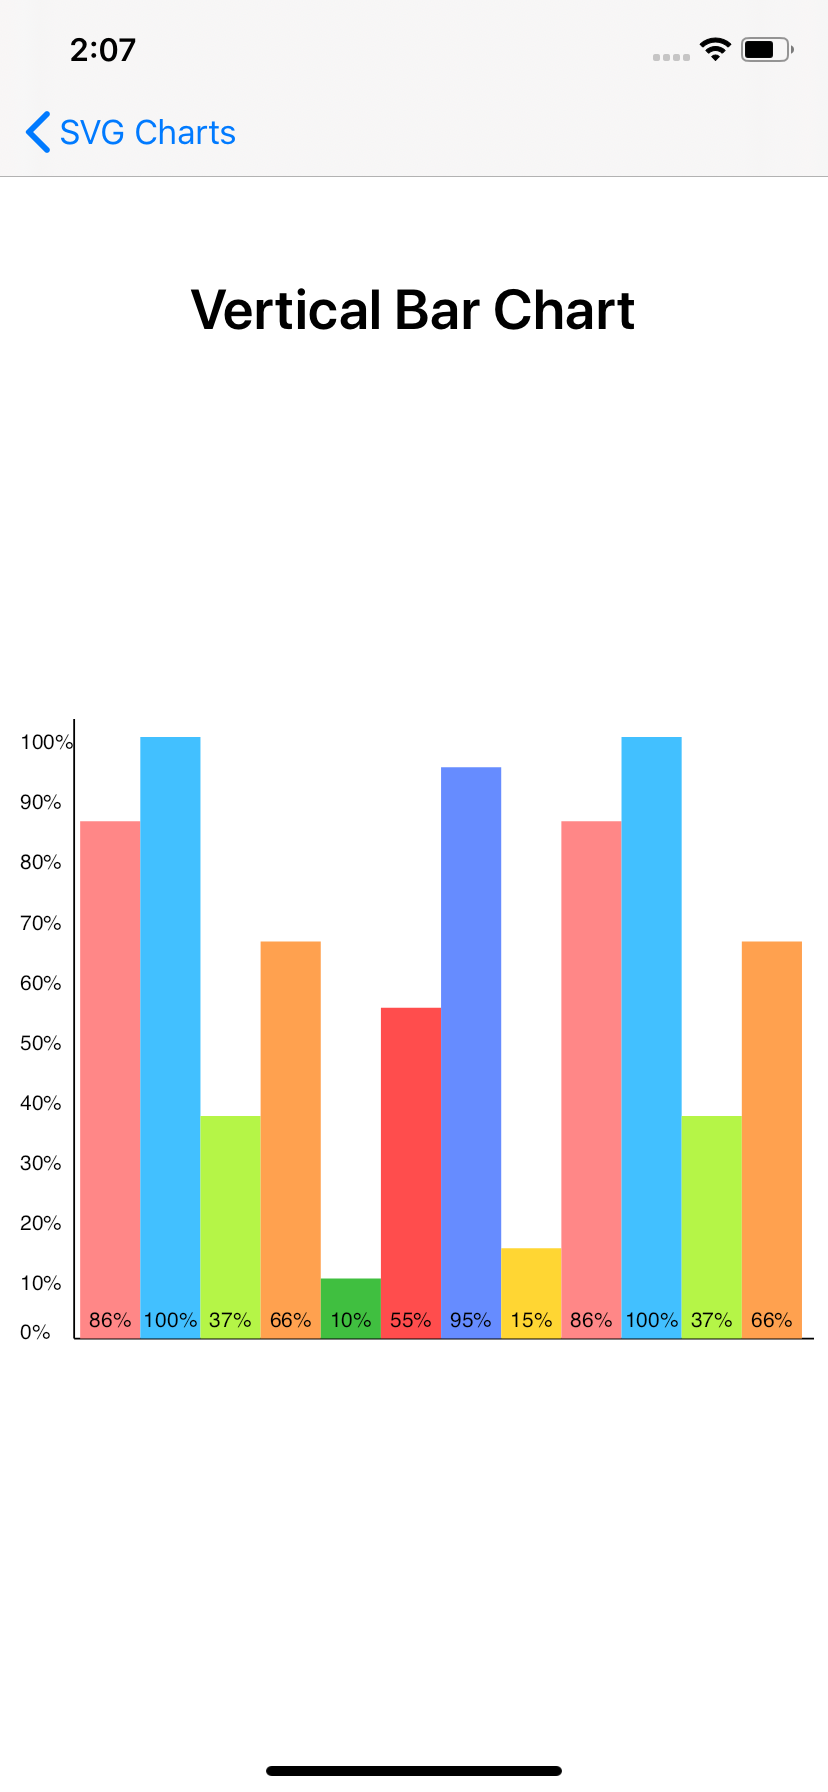
Vertical Bar Chart.
- DisplayValues
- BarWidth
-
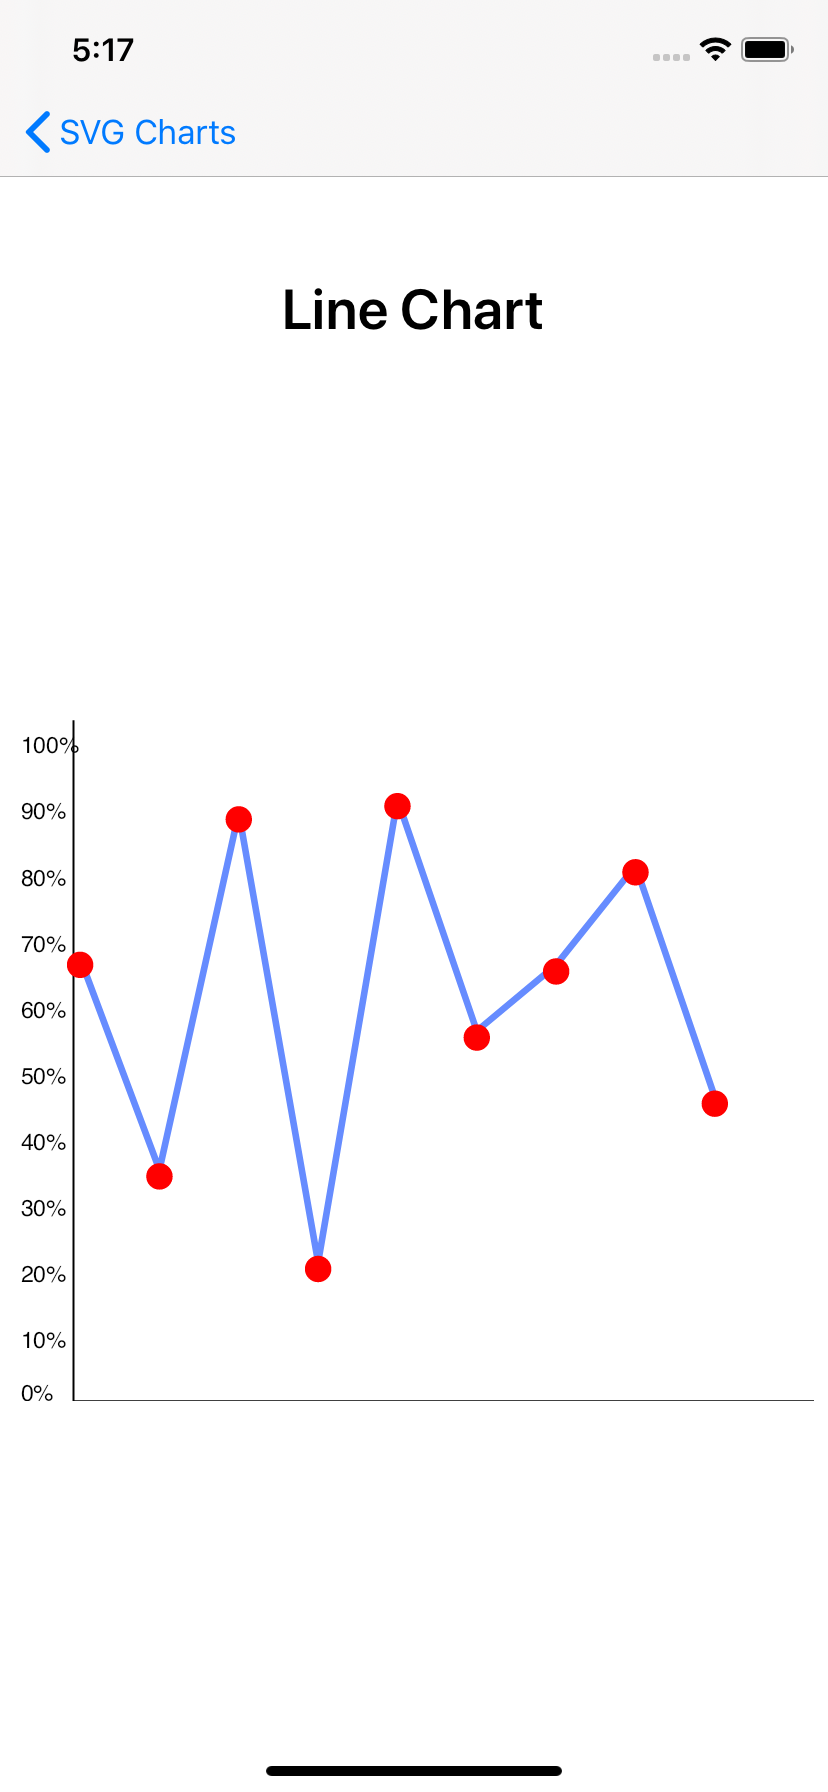
Line Chart
- LineColor
- PointsColor
- PointsDistance
- PointSize
- LineWidth
- ShowPoints
For Horizontal and Vertical Bar Chart add the a list with the percentage and color of each bar.
new List<Tuple<int, string>>()
{
    new Tuple<int, string>(86, "#ff8787"),
    new Tuple<int, string>(100, "#42c0ff"),
    new Tuple<int, string>(37, "#b5f547"),
    new Tuple<int, string>(100, "#ffa14f"),
};
For Donut Chart add the a list with the percentage and color of each segment.
new List<Tuple<int, string>>()
{
    new Tuple<int, string>(20, "#ff8787"),
    new Tuple<int, string>(10, "#42c0ff"),
    new Tuple<int, string>(35, "#b5f547")
};
For Line Chart just add a list of percentage for the position of each point.
new List<int>()
{
   66,34,88,20,90,55,65,80,45
};Code released under the MIT license.


