Ricardo Zacarias
Using data for complaints made to the NYPD, I employed ARIMA models to forecast crime rates in New York City. Next, I applied an unsupervised clustering algorithm to identify hotspots of criminal activity. Clusters were defined geographically and temporally to suggest areas and schedules for patrolling. I compared the performance of the model with a random baseline model.
In this project I used publicly available data from NYC's data portal and a few other sources.
NYC Historical Crime Rates 2000-2019
NYPD Complaint Data Historic (2007-2018)
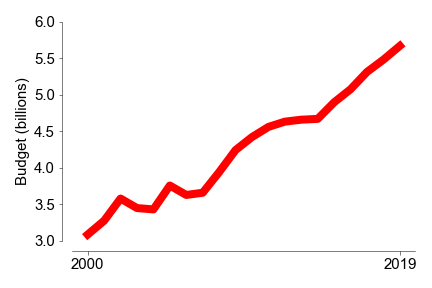
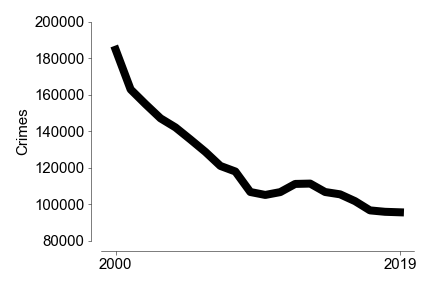
The following two charts show the evolution of the budget for the NYPD and crime rates in the city for the past 20 years. The amount of money spent on policing has nearly doubled in that period and, while crime has also seen a decline, it has remained fairly constant over the last ~10 years or so.
Even for the initial period, some studies suggest that mental health programs or the legalization of abortion were the main drivers of that observed decrease. In the end it seems that crime is not a problem you can solve by continued investment on policing. Still, law enforcement is a fundamental part of a functional community. My questions is: can we use machine learning algorithms to optimize the distribution of resources to prevent crime?
Crime is a notoriously seasonal activity and has been studied extensively. The first step in my analysis was to see if I could forecast the total number of crimes each month. To accomplish this I used an ARIMA model including the first 10 years of the data set (2007-2016) as training to predict the last two years (2017-18). In the interest of saving memory, in this analysis I only included the following crimes:
Violent crime: felony assault and robbery.
Property crime: burglary, grand larceny and grand theft auto.
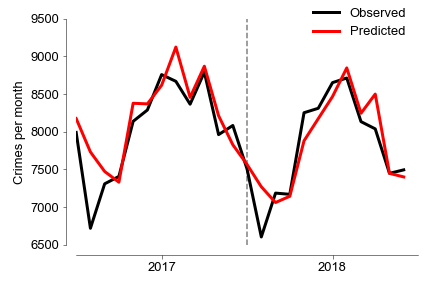
These were the forecasting results:
The ARIMA analysis yielded a mean absolute error of 224.7 for predictions in the order of ~8k. While it looks promising, this is not how police departments work in any city. There is not one single station that is responsible for all of this crime. In fact, NYC is divided into 77 police departments (called precincts), so I repeated this analysis for each individual precinct.
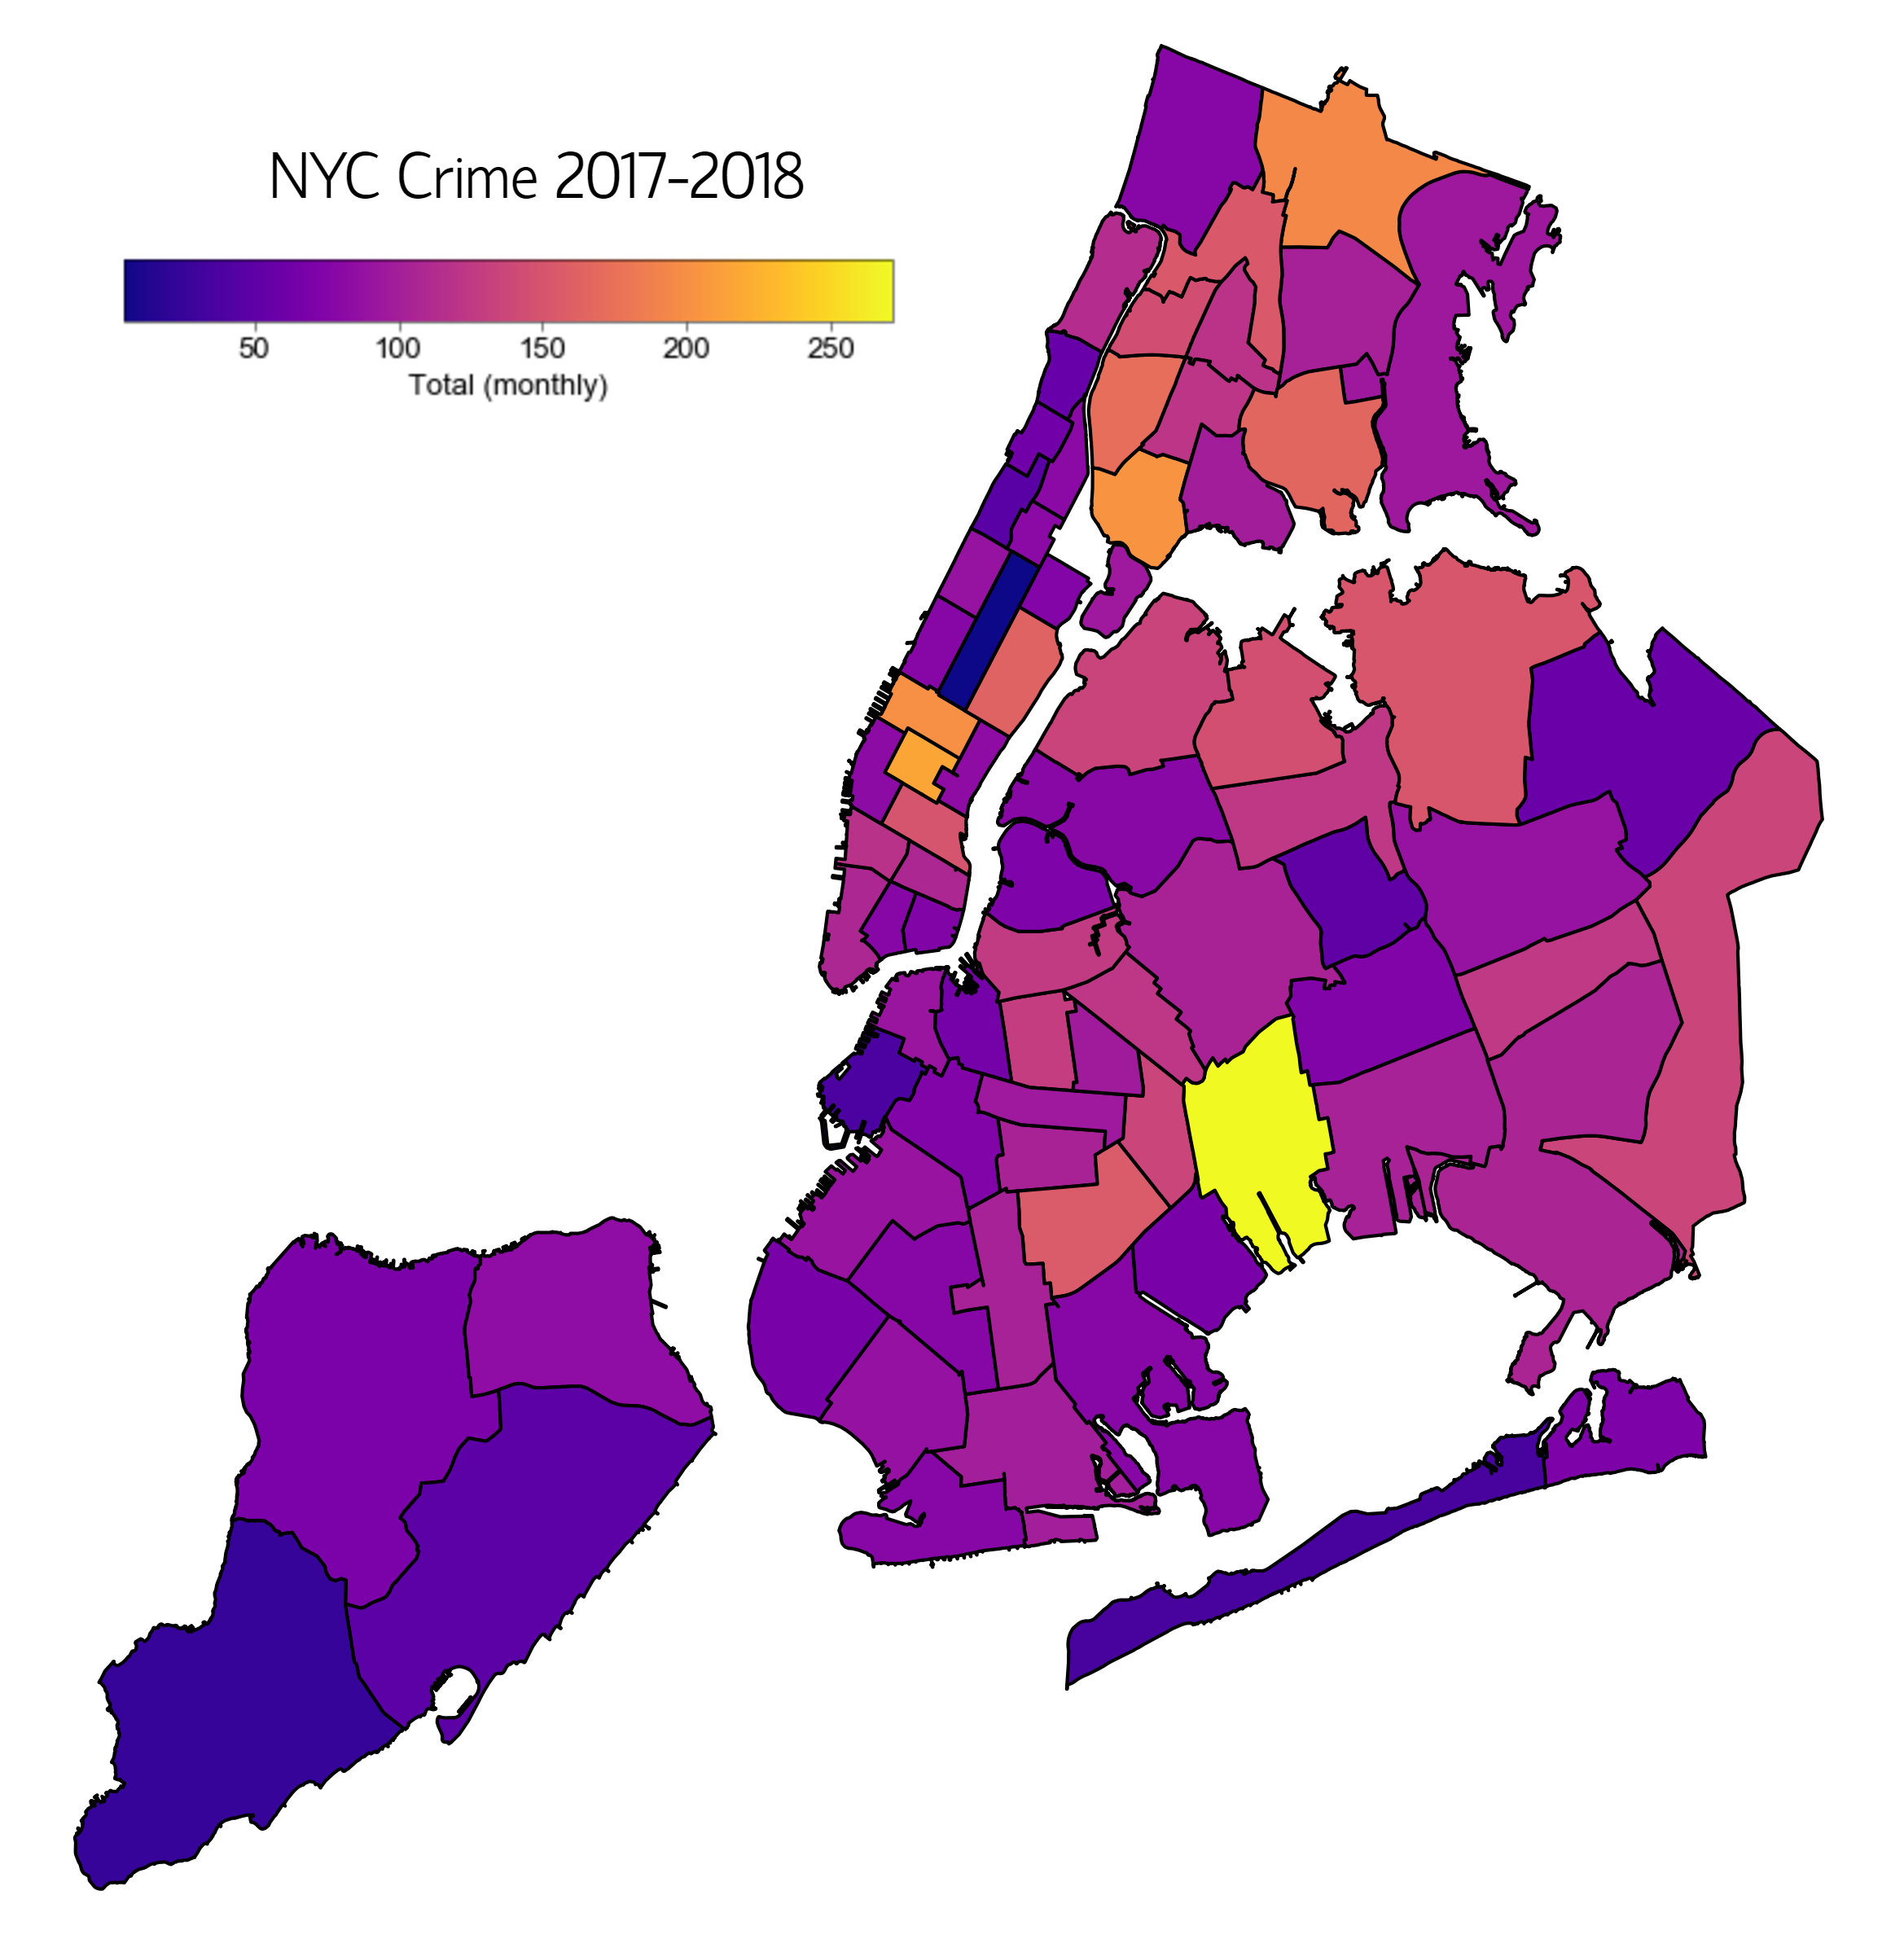
This map summarizes the forecast by averaging the number of crimes in each precinct for 2017 and 2018. The raw monthly forecast for this period in each precinct can be found in this file.
So now we know how much crime is gonna happen in each precinct, but this is still a very rough prediction and very much far from actionable information that could be used in prevention.
In order to make more specific predictions about crime I decided to focus the analysis on only two types of crimes: burglary and robbery. I chose these two because they are both very common but they are also very different in nature.
- Burglary: non-violent crime that requires some preparation and tools.
- Robbery: violent crime that mostly requires opportunity.
Having selected these two different types of crimes I designed an algorithm that goes as follows.
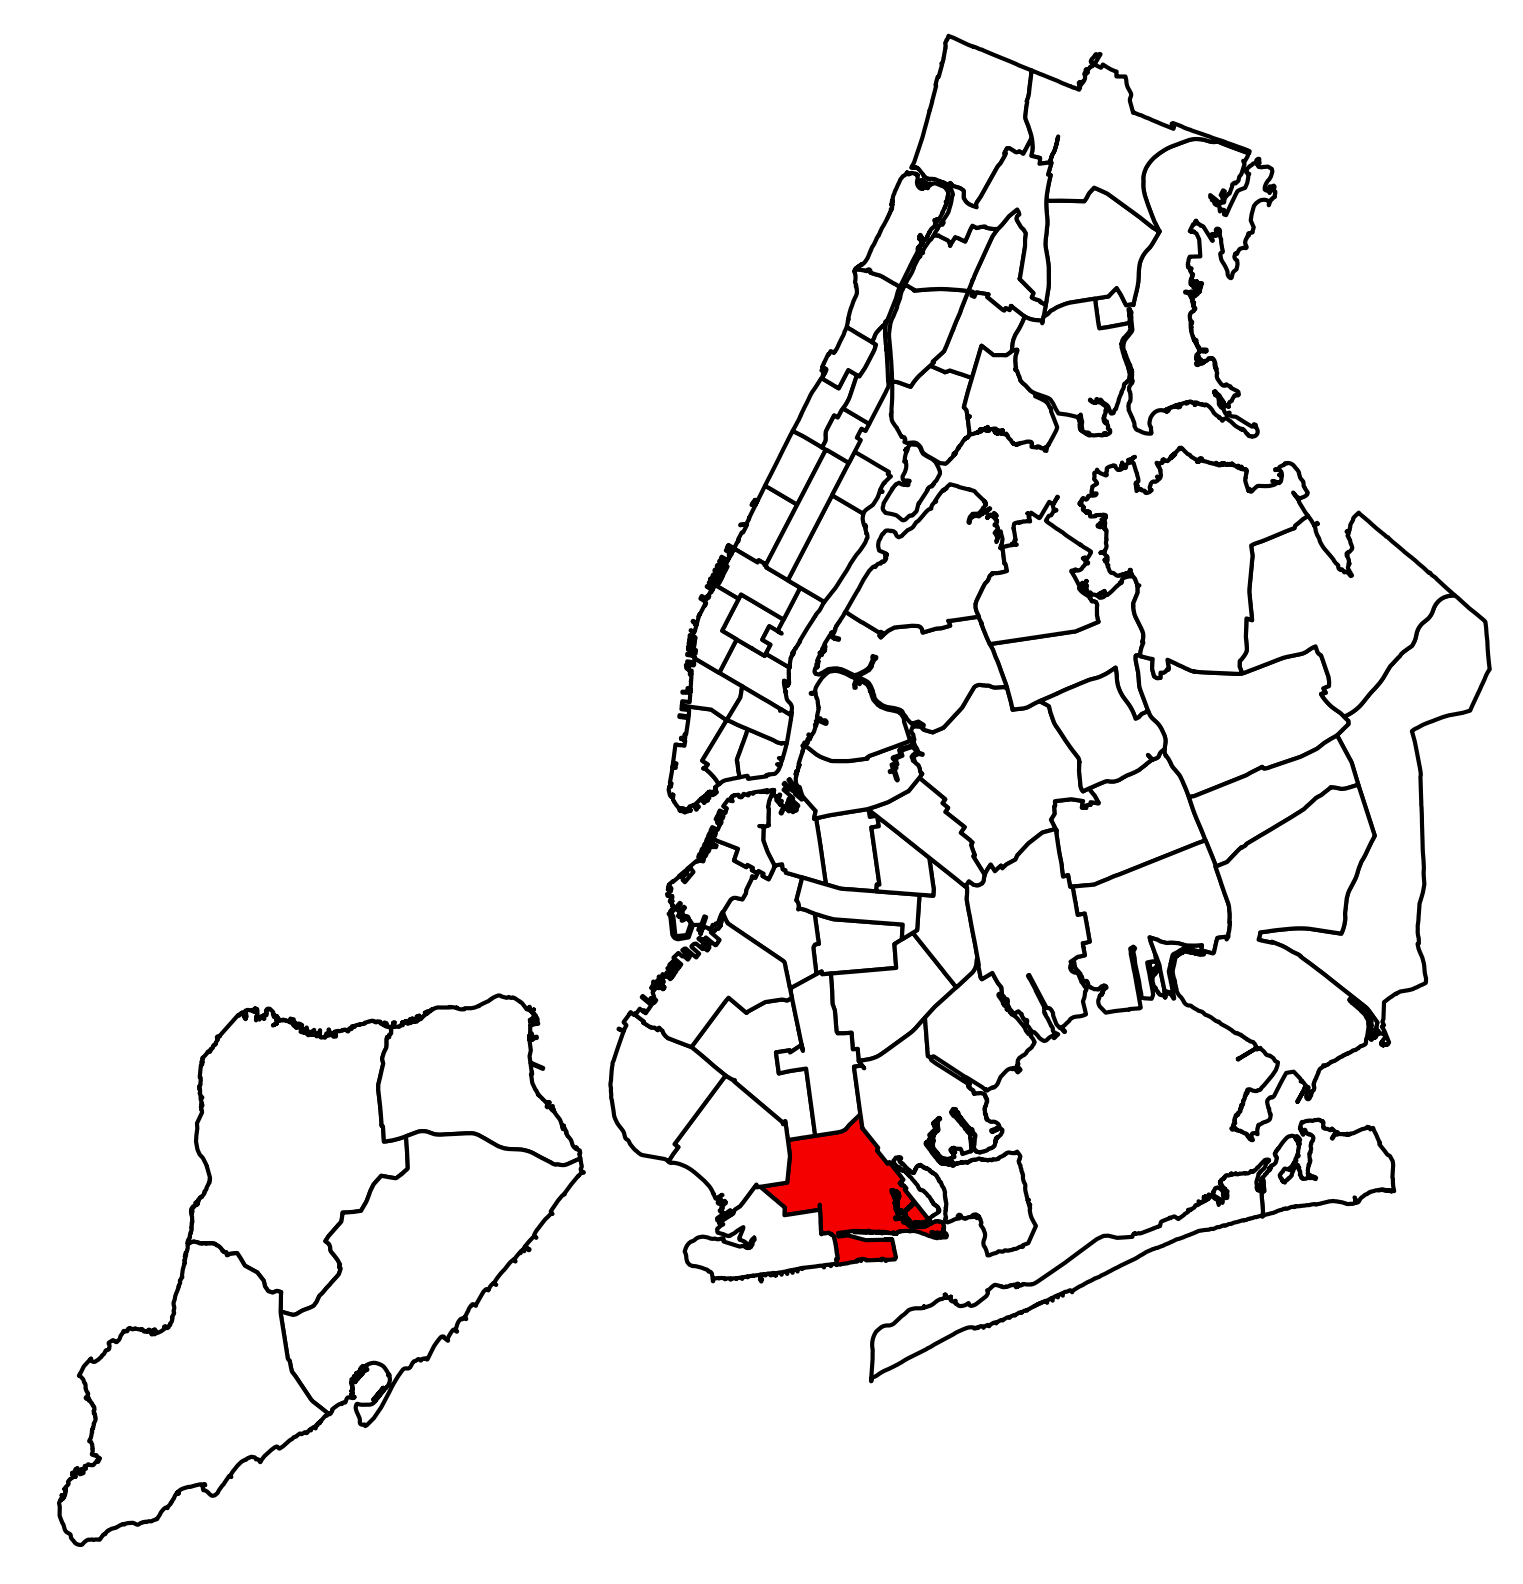
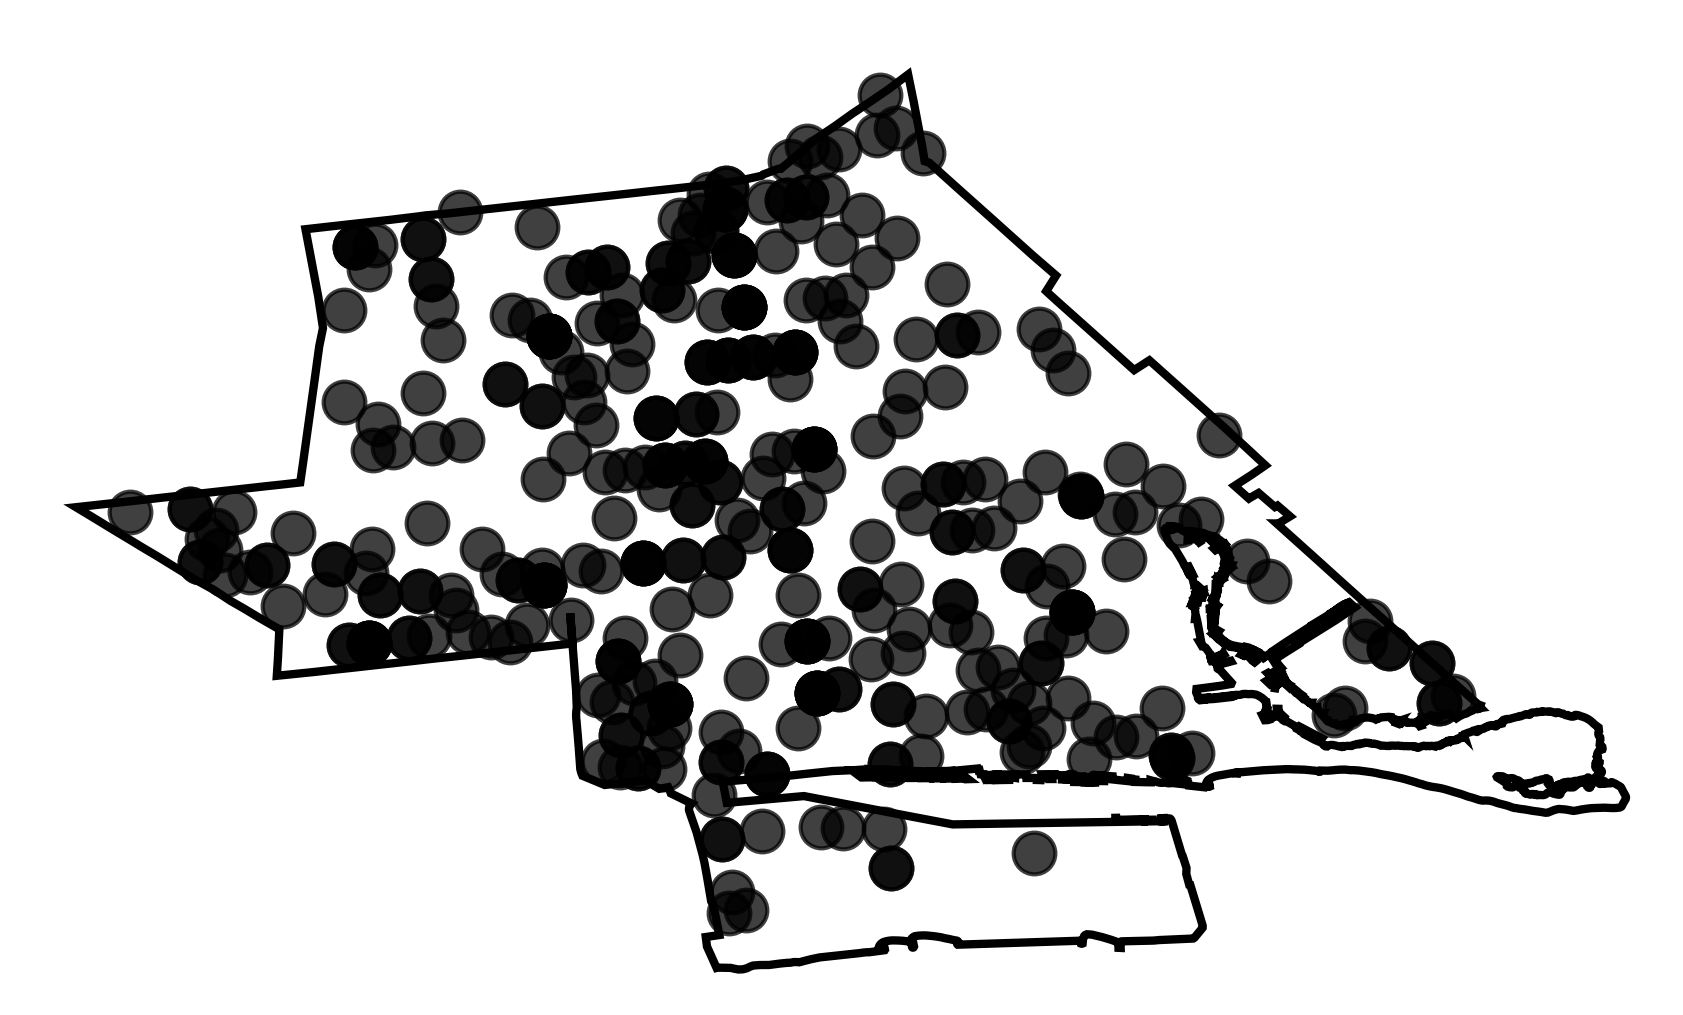
To start, I will take only one precinct as an example (61st). I will try to spatio-temporally predict crimes for January 2017 using the two years before as training (Jan 2015 - Dec 2016)
- Geolocation of all the burglaries that happened inside that area during the training period.
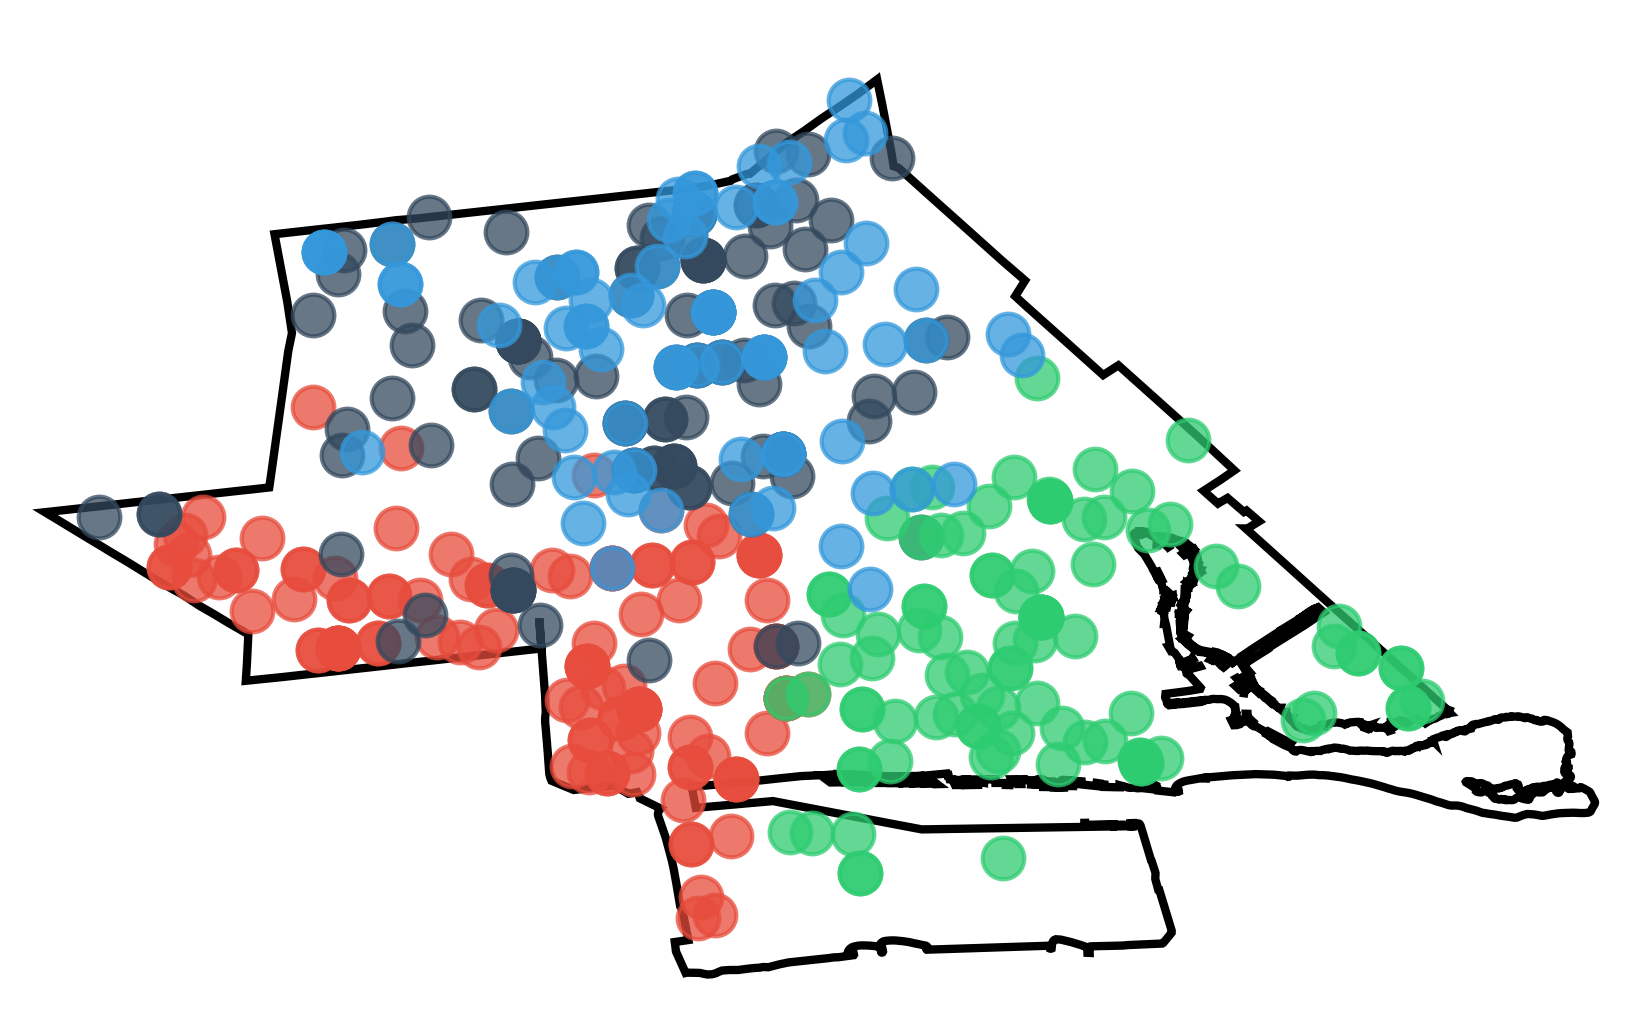
- Unsupervised clustering (K-Means, k=4) of events using only two features: geographical coordinates and time of day when the crime took place.
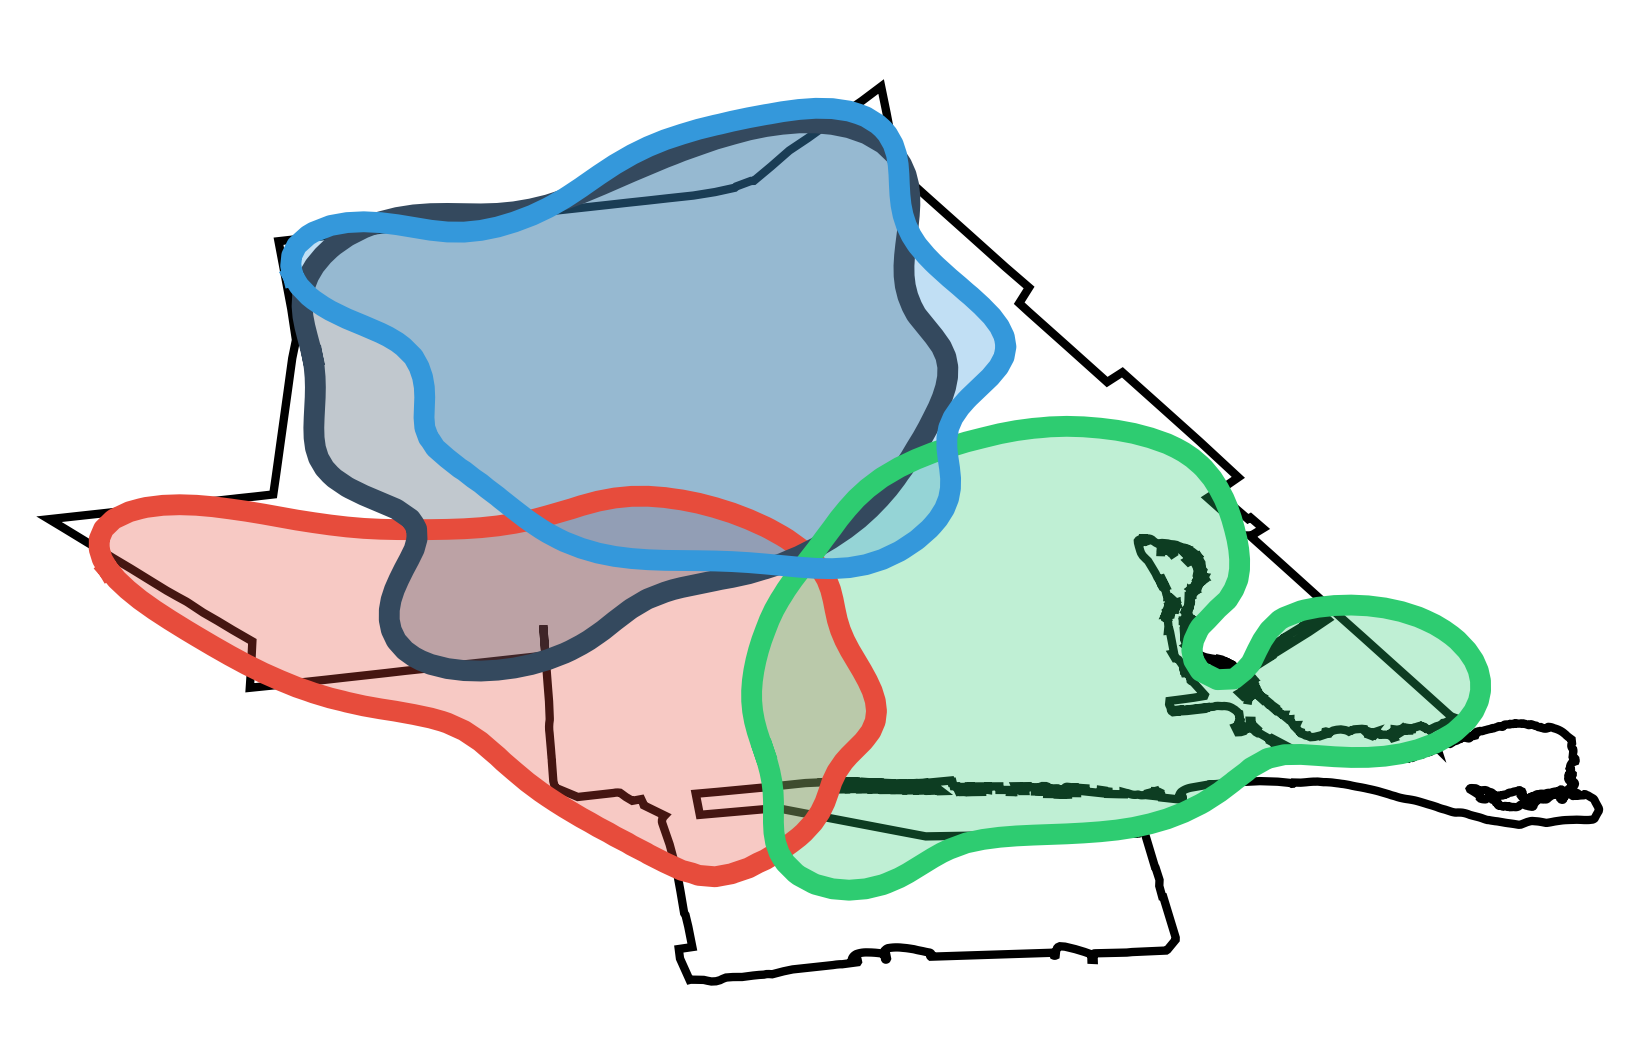
- Once we have our clusters we fit a gaussian KDE to each cluster and extract the contour to define the geographical area.
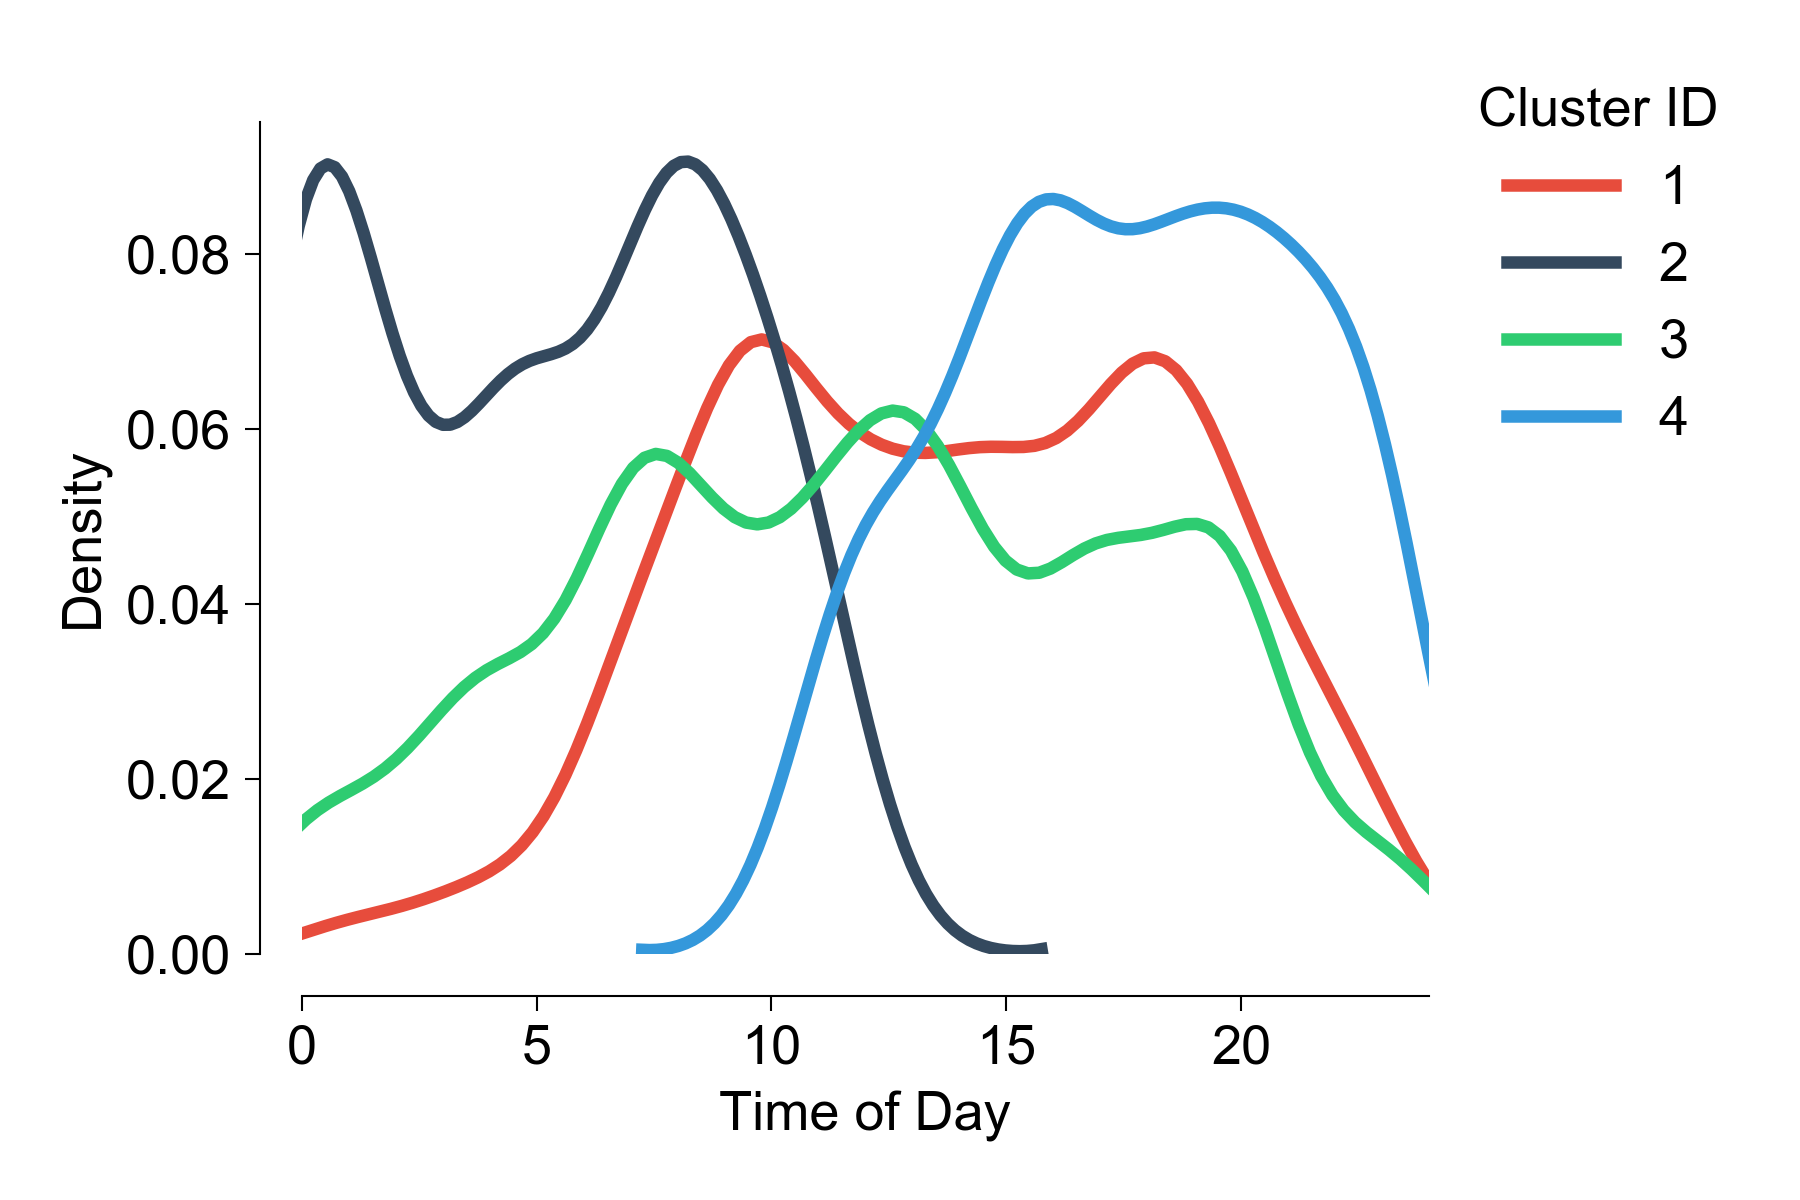
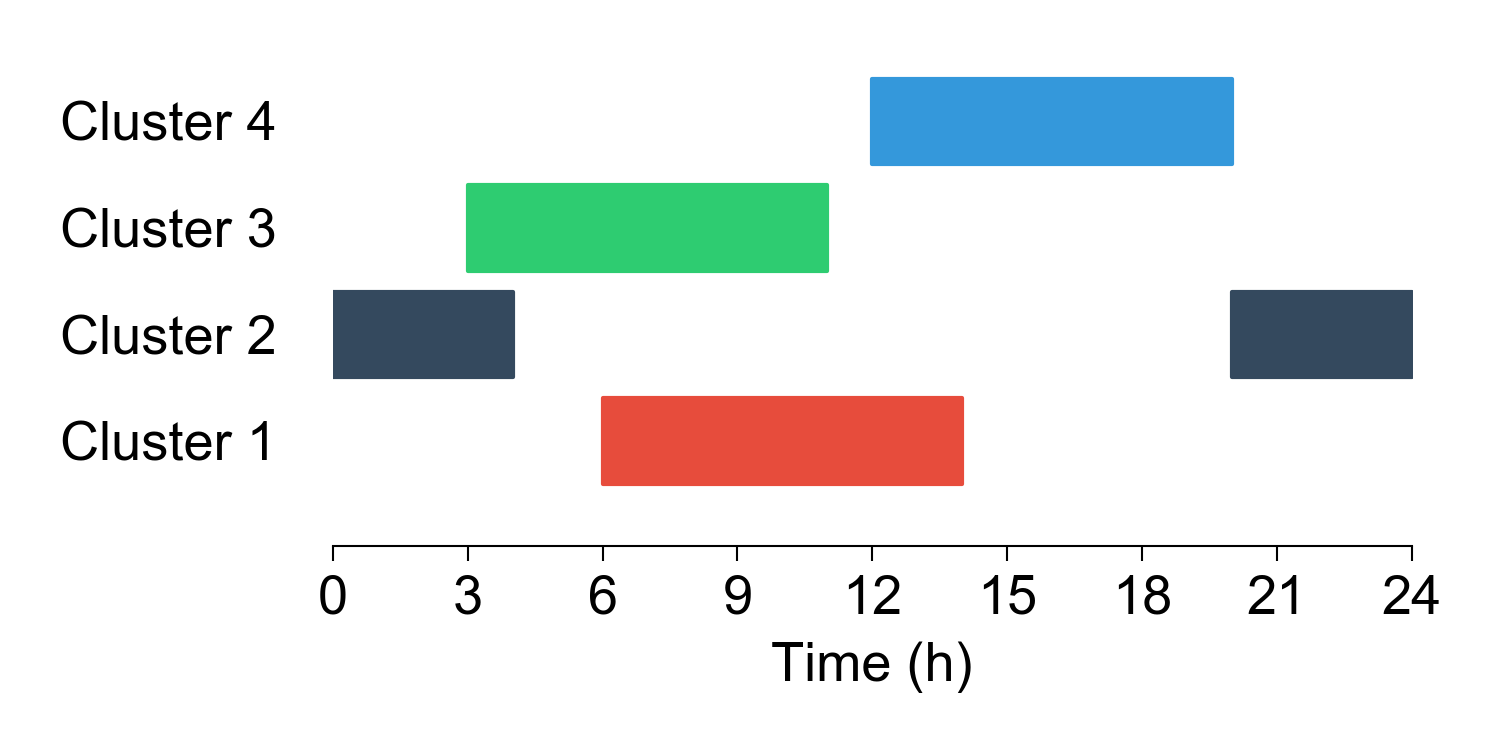
- Having defined our clusters in space, next I looked at the temporal component of each cluster. Using the peak from these distributions (mode) I calculated a vigilance schedule.
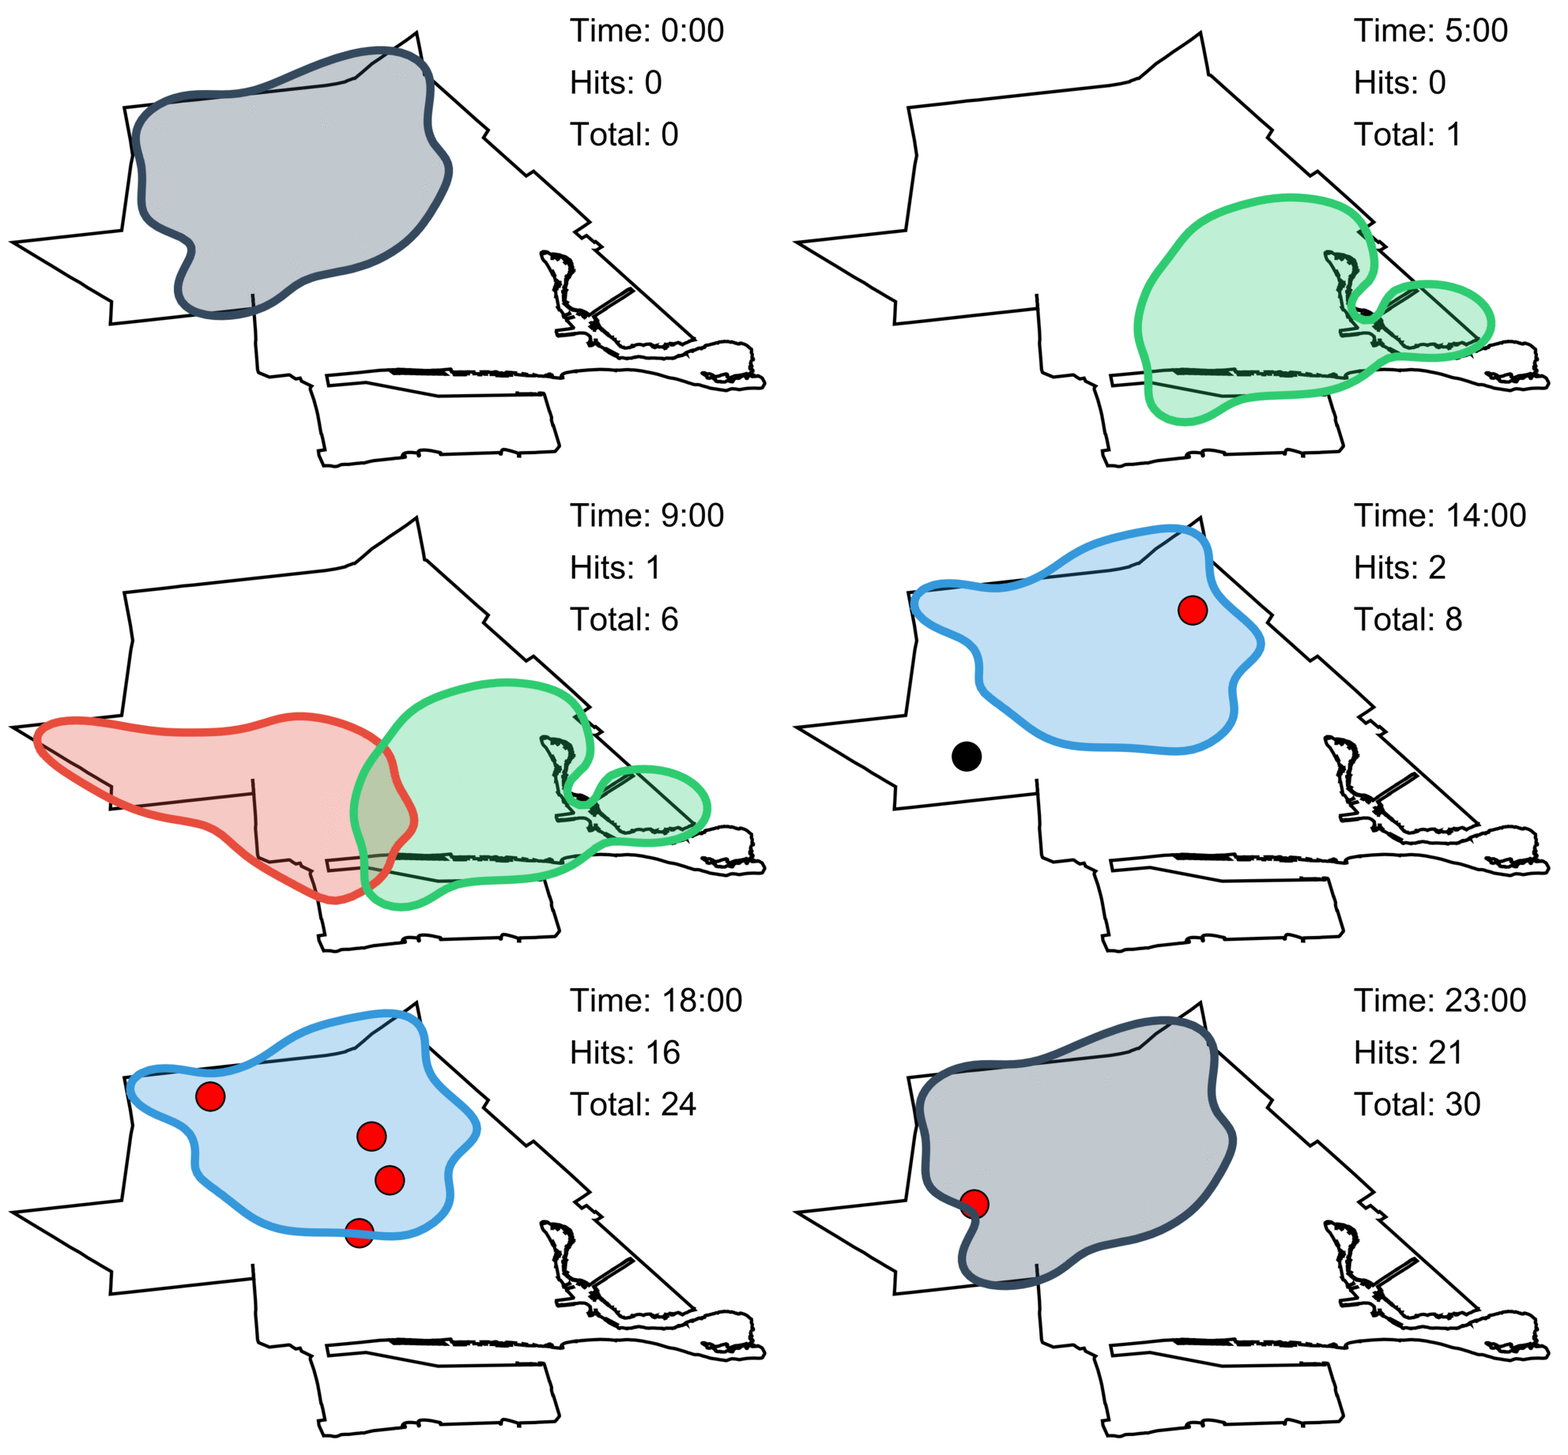
- With these hotspots of criminal activity defined in time and space, we can now score the performance of the algorithm. I input the testing data and, if a crime happens inside of a cluster during its temporal window of activity then it is counted as a hit; if a t crime doesn't meet these two conditions, then it is a miss. How this works can be better visualized in this gif:
The figures above represent the analysis for one precinct and predicting one month only. To more accurately evaluate this model, I generalized the algorithm and ran it for the top 5 most dangerous precincts, making monthly predictions for a period of 2 years (2017 and 2018).
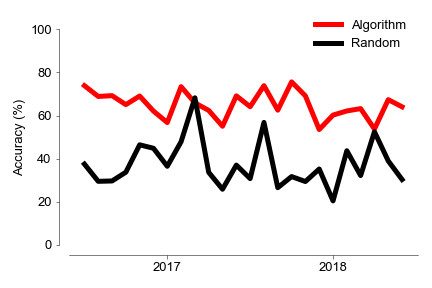
To have some form of reference for the accuracy of the model, I also repeated this entire method but instead generating random clusters. This way, we can at least compare how our clustering algorithm performs against just randomly subdividing a region and creating random patrol schedules.
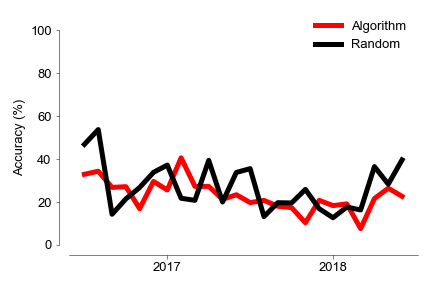
Regarding burglaries, the global accuracy for our algorithm was 65% while it was 37.6% for a random cluster method. The algorithm performs consistently better than random for the whole testing period. For robberies however, we observe a completely different pattern. In fact, the random method scores (27.6%) slightly higher than our clustering algorithm (23.2%).
A possible explanation for this result could be that our clustering is underfitting. After all, we are only introducing two features into the algorithm (time and space). Another possibility is this result could be a reflection that crimes of opportunity, such as robberies, are inherently more random and thus much harder to predict.
- Crime is a seasonal activity (peaks in summer). This feature facilitates forecasting, even for individual stations.
- Our algorithm provides a spatial and temporal window that can predict ~65% of burglaries.
- But what works for some crimes might not be useful for other types. Planned crimes could be more predictable than crimes of opportunity.
- Our model is very likely underfitting. A possible solution would be to include more features.
- Extend to other crime types, other locations.
- Optimize parameters of cluster definition (geography and time windows).
- This type of analysis could be useful for predictive or investigative policing.
- Security companies (guards, alarms, etc).
- Insurance companies.
