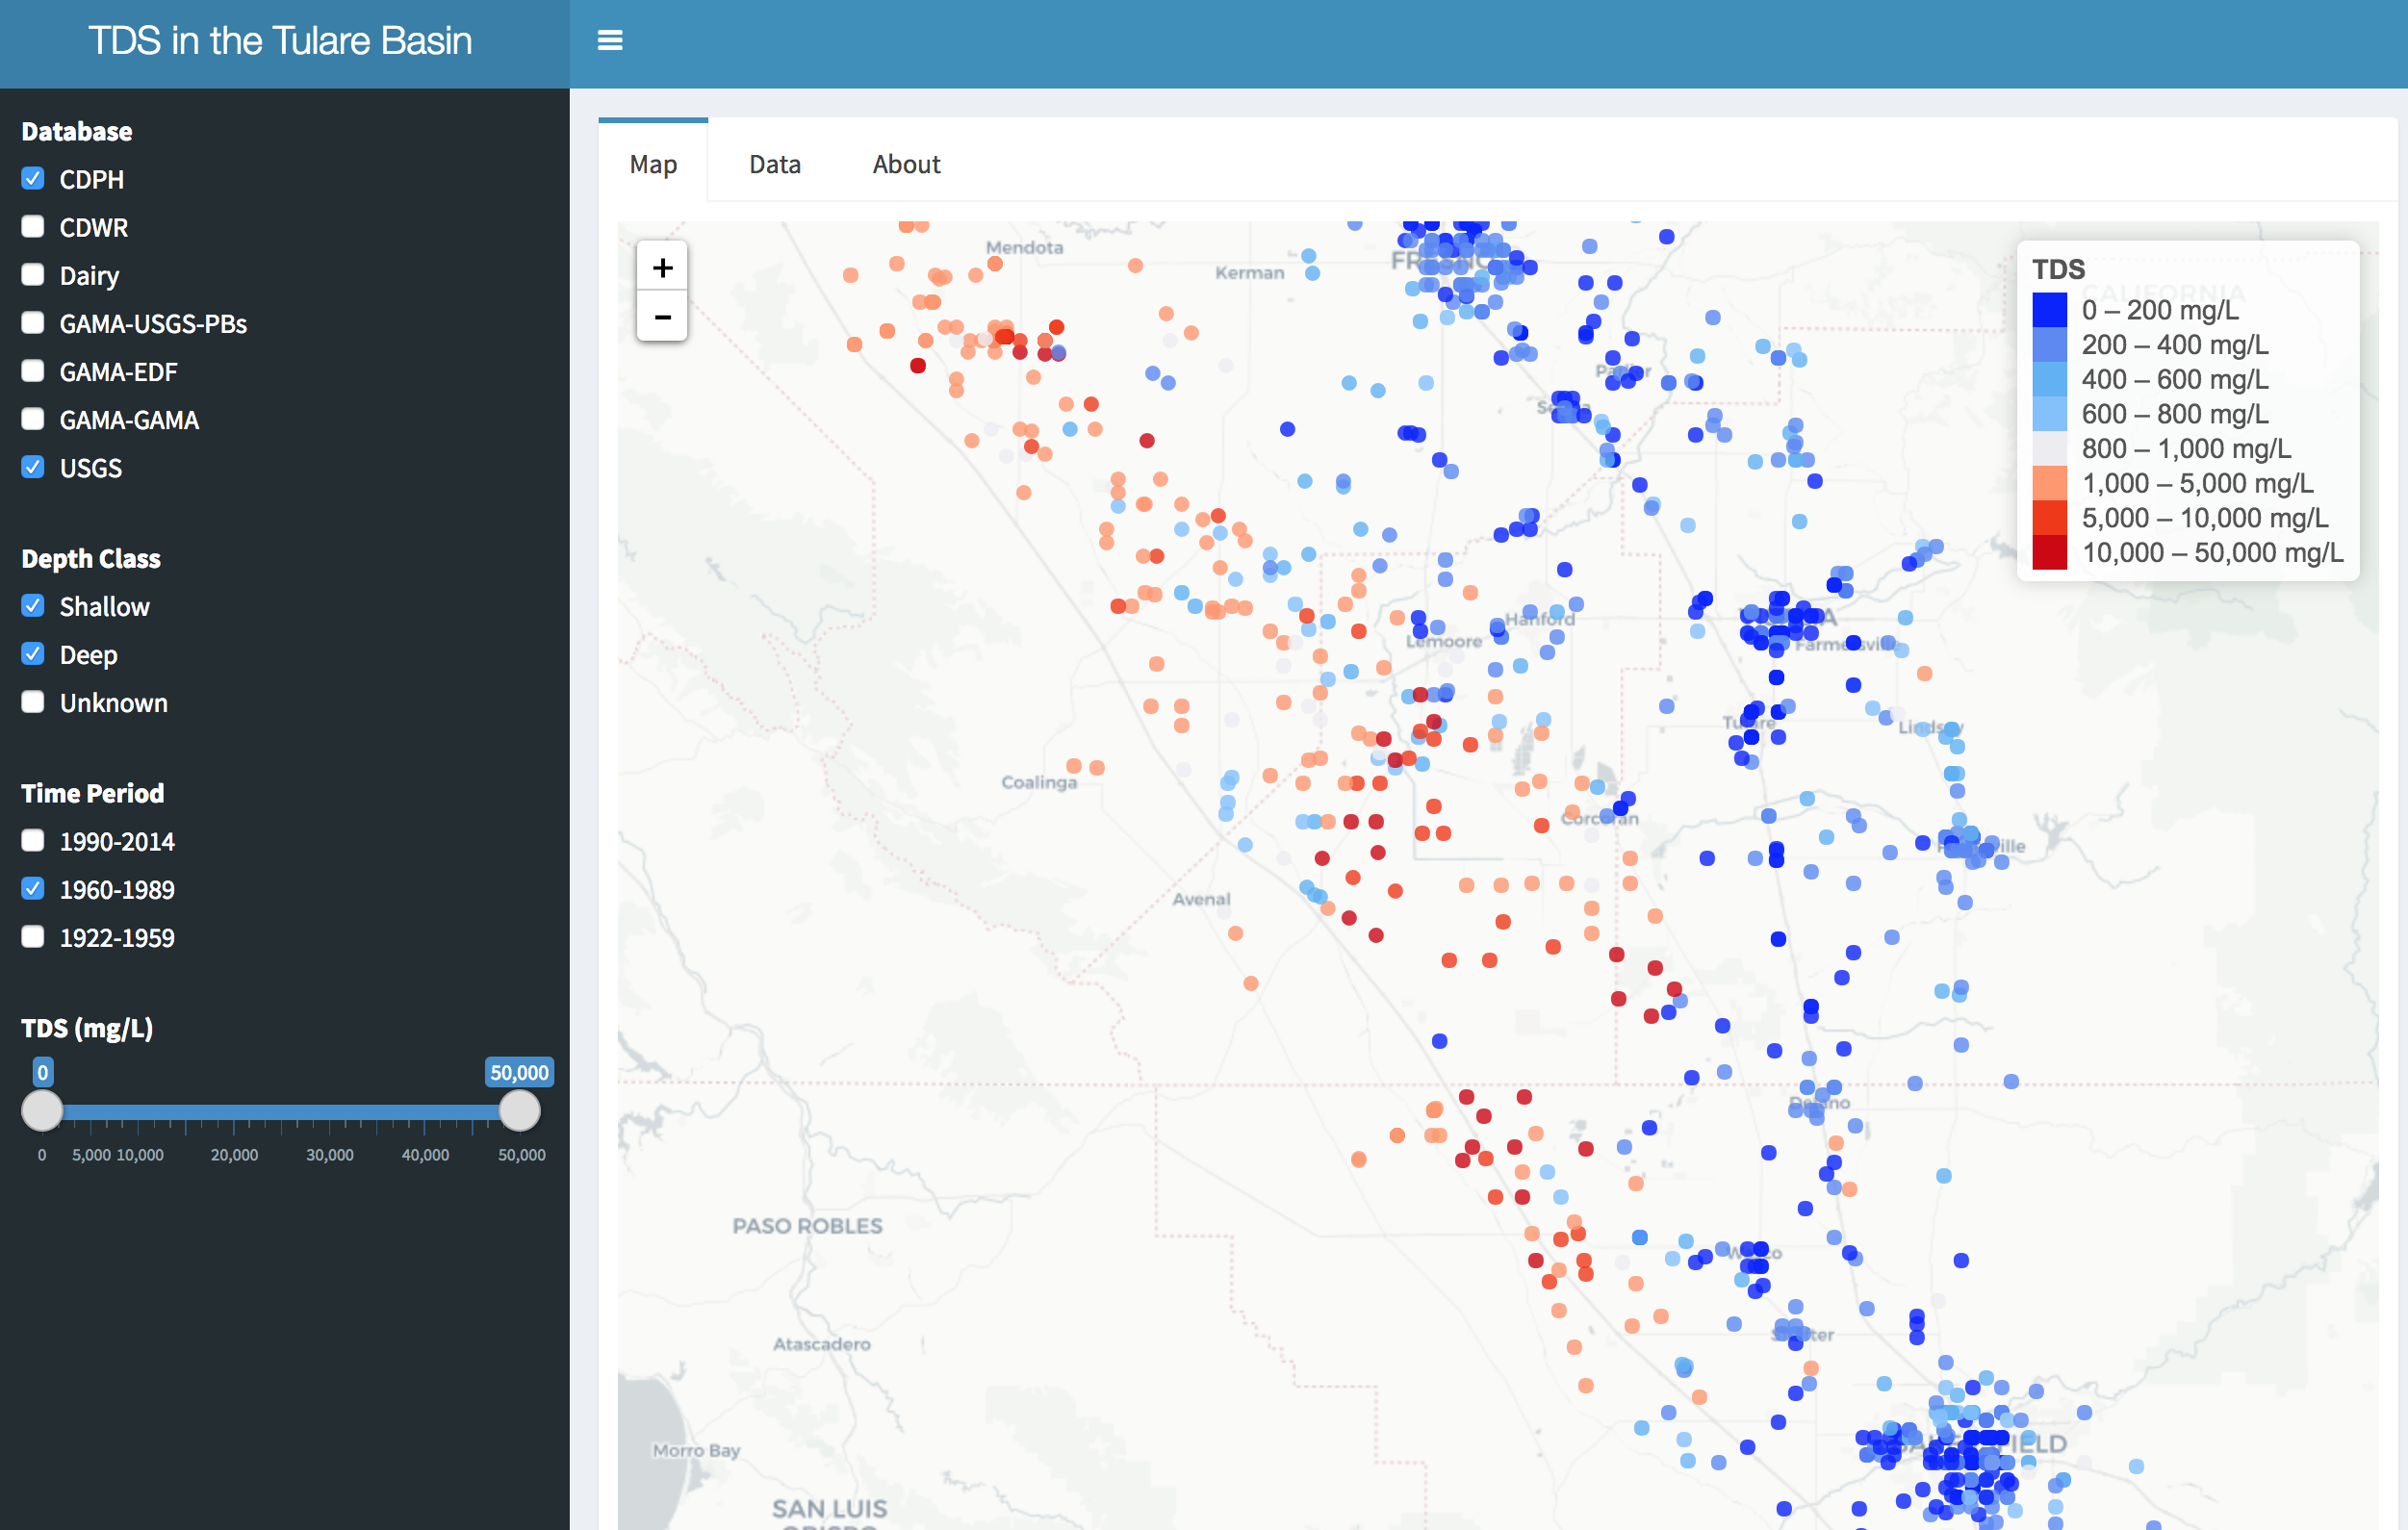
click on the picture to open the app
This R Shiny web application presents all publically acessible data for Total Dissolved Solids (TDS) in groundwater measured at wells in the Tulare Basin, California. Observations on the map represent the median value for individual wells grouped by time period.
Data was scraped by CV-SALTS and CDM Smith, and aggregated from many sources, including:
- United States Geologic Survey
- California Department of Public Health
- Groundwater Ambient Monitoring and Assessment Program
- Environmental Defense Fund
- California Department of Water Resources
- independent dairy farm monitoring wells
I would like to thank CDM Smith for helping acquire this data. I am also grateful to Matthew Leonawicz, who makes beautiful shiny apps, and whose work inspired and guided the design of my own.
Depth Class was determined by categorical data for each well. From “Initial Conceptual Model (ICM) Technical Services Tasks 7 and 8 – Salt and Nitrate Analysis for the Central Valley Floor and a Focused Analysis of Modesto and Kings Subregions Final Report” (Larry Walker Associates, 2013):
Wells were classified into three depth classes (Shallow, Deep, and Unknown) based on information provided by the original source, as shown in Table 3-2. Most wells in the database did not contain quantitative information on well depth or screened interval; however, other information such as well type was used when available to infer the depth from which a well was sampled. Only the USGS database contained quantitative information regarding well depth. For wells lacking a specified value of well depth, the well type was used to infer the depth (see Table 3-2 for examples). Wells in the DWR, GeotrackerGAMA, and RWQCB WDR Dairy Data databases sometimes contain a description of the well type which enabled categorization of the well into a depth class. All wells from the DPH database were assumed to be drinking water supply wells.
Irrigation/agricultural, industrial, and municipal supply wells were classified as “Deep” whereas domestic wells and monitoring wells were classified as “Shallow”. All DPH wells were therefore classified as “Deep” as these were all assumed to be drinking water supply wells. All other well types were classified as “Unknown”.
A large number of USGS wells provided numerical values for well depth; therefore, these were used when provided. USGS wells were assigned a depth class based on the 20-year travel depth for a particular CVHM cell that it was located within. Wells with a depth less than the 20-year travel depth were classified as “Shallow,” and those below the 20-year travel depth were classified as “Deep”. Wells without depth information or a well type were classified as “Unknown”.
Wells from the USGS database contain explicit depth information and can be used as a proxy to estimate the ranges of depth for each well class. Wells classified as Shallow and Deep within the USGS database have the following sample statistics:
Shallow wells (n = 468) have a mean depth of 67.67 ft. with a standard deviation of 101.72 ft.
Deep wells (n = 616) have a mean depth of 653.81 ft. with a standard deviation of 483.69 ft.
Larry Walker Associates. 2013. “Initial Conceptual Model (ICM) Technical Services Tasks 7 and 8 – Salt and Nitrate Analysis for the Central Valley Floor and a Focused Analysis of Modesto and Kings Subregions Final Report.”