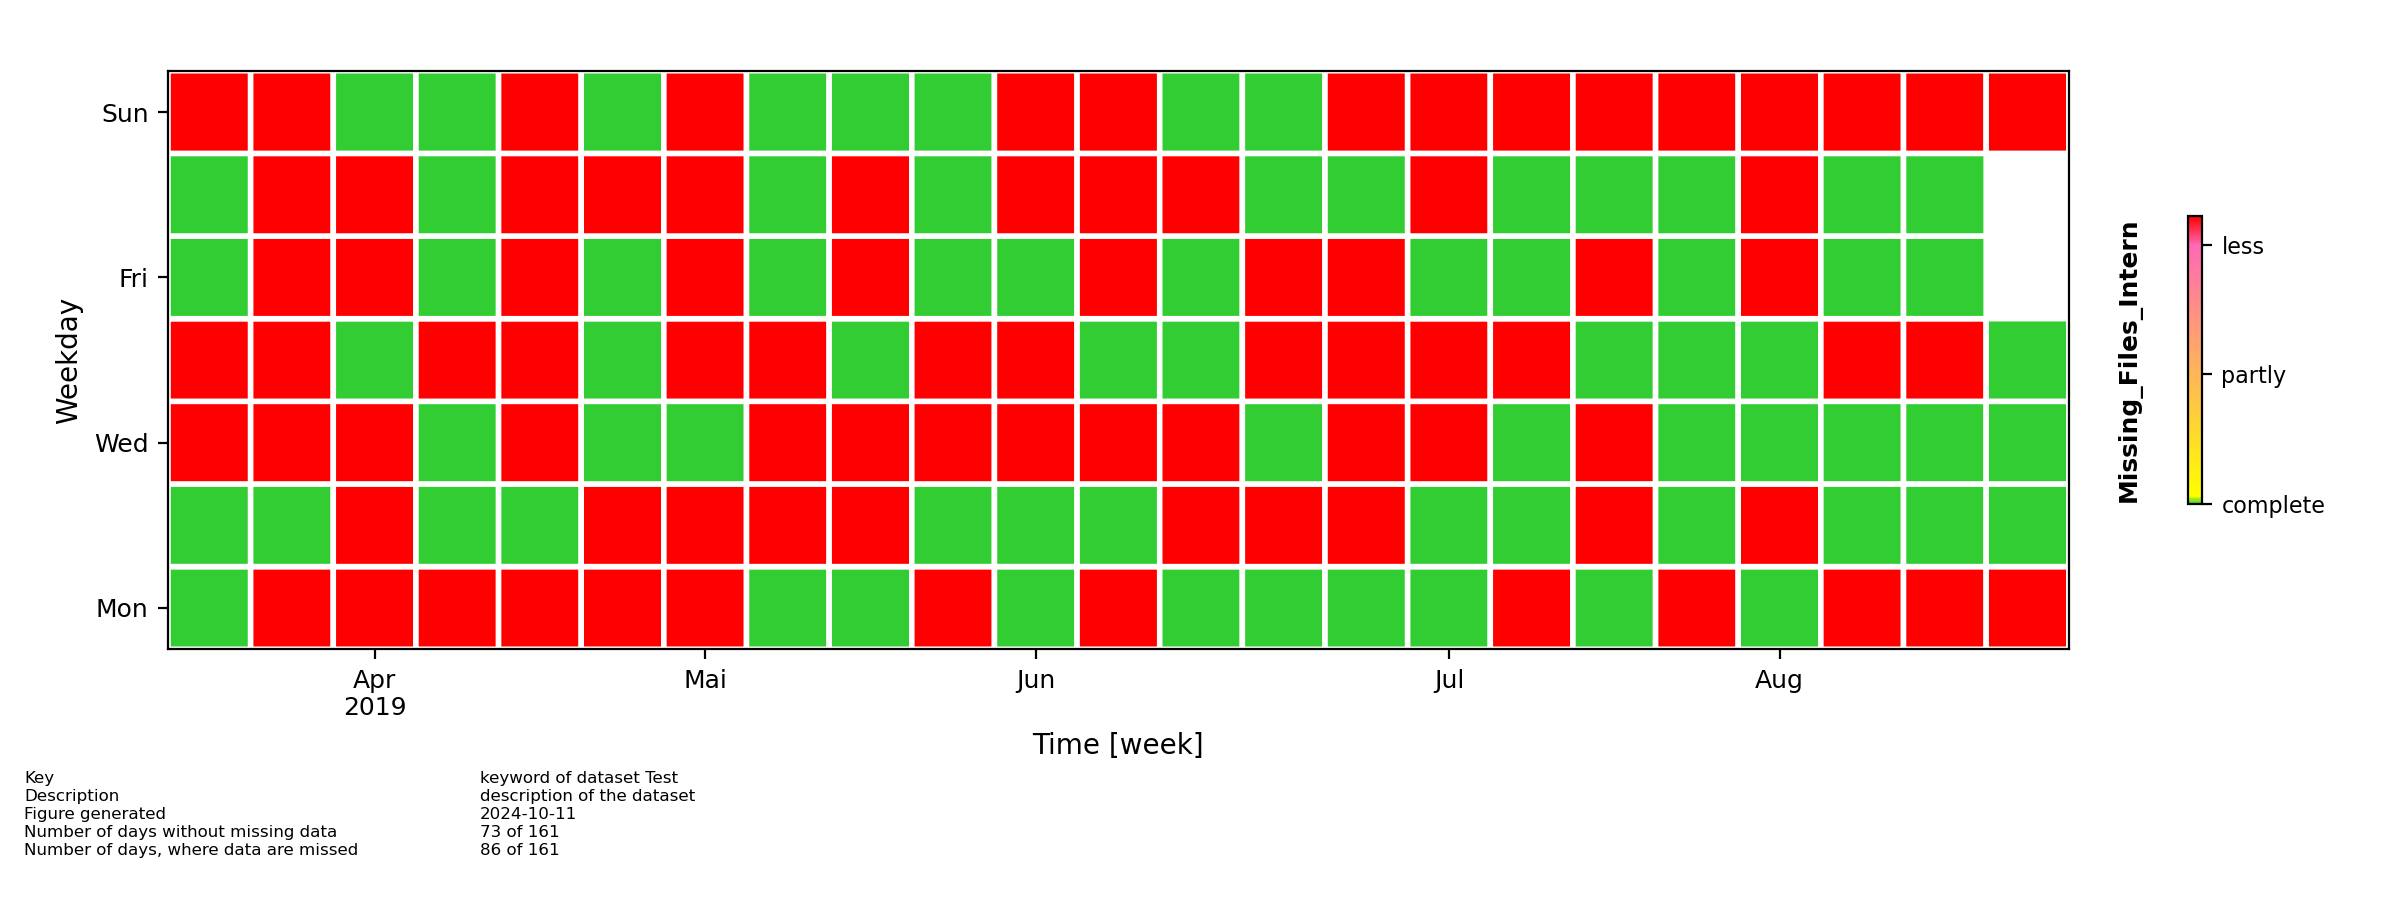
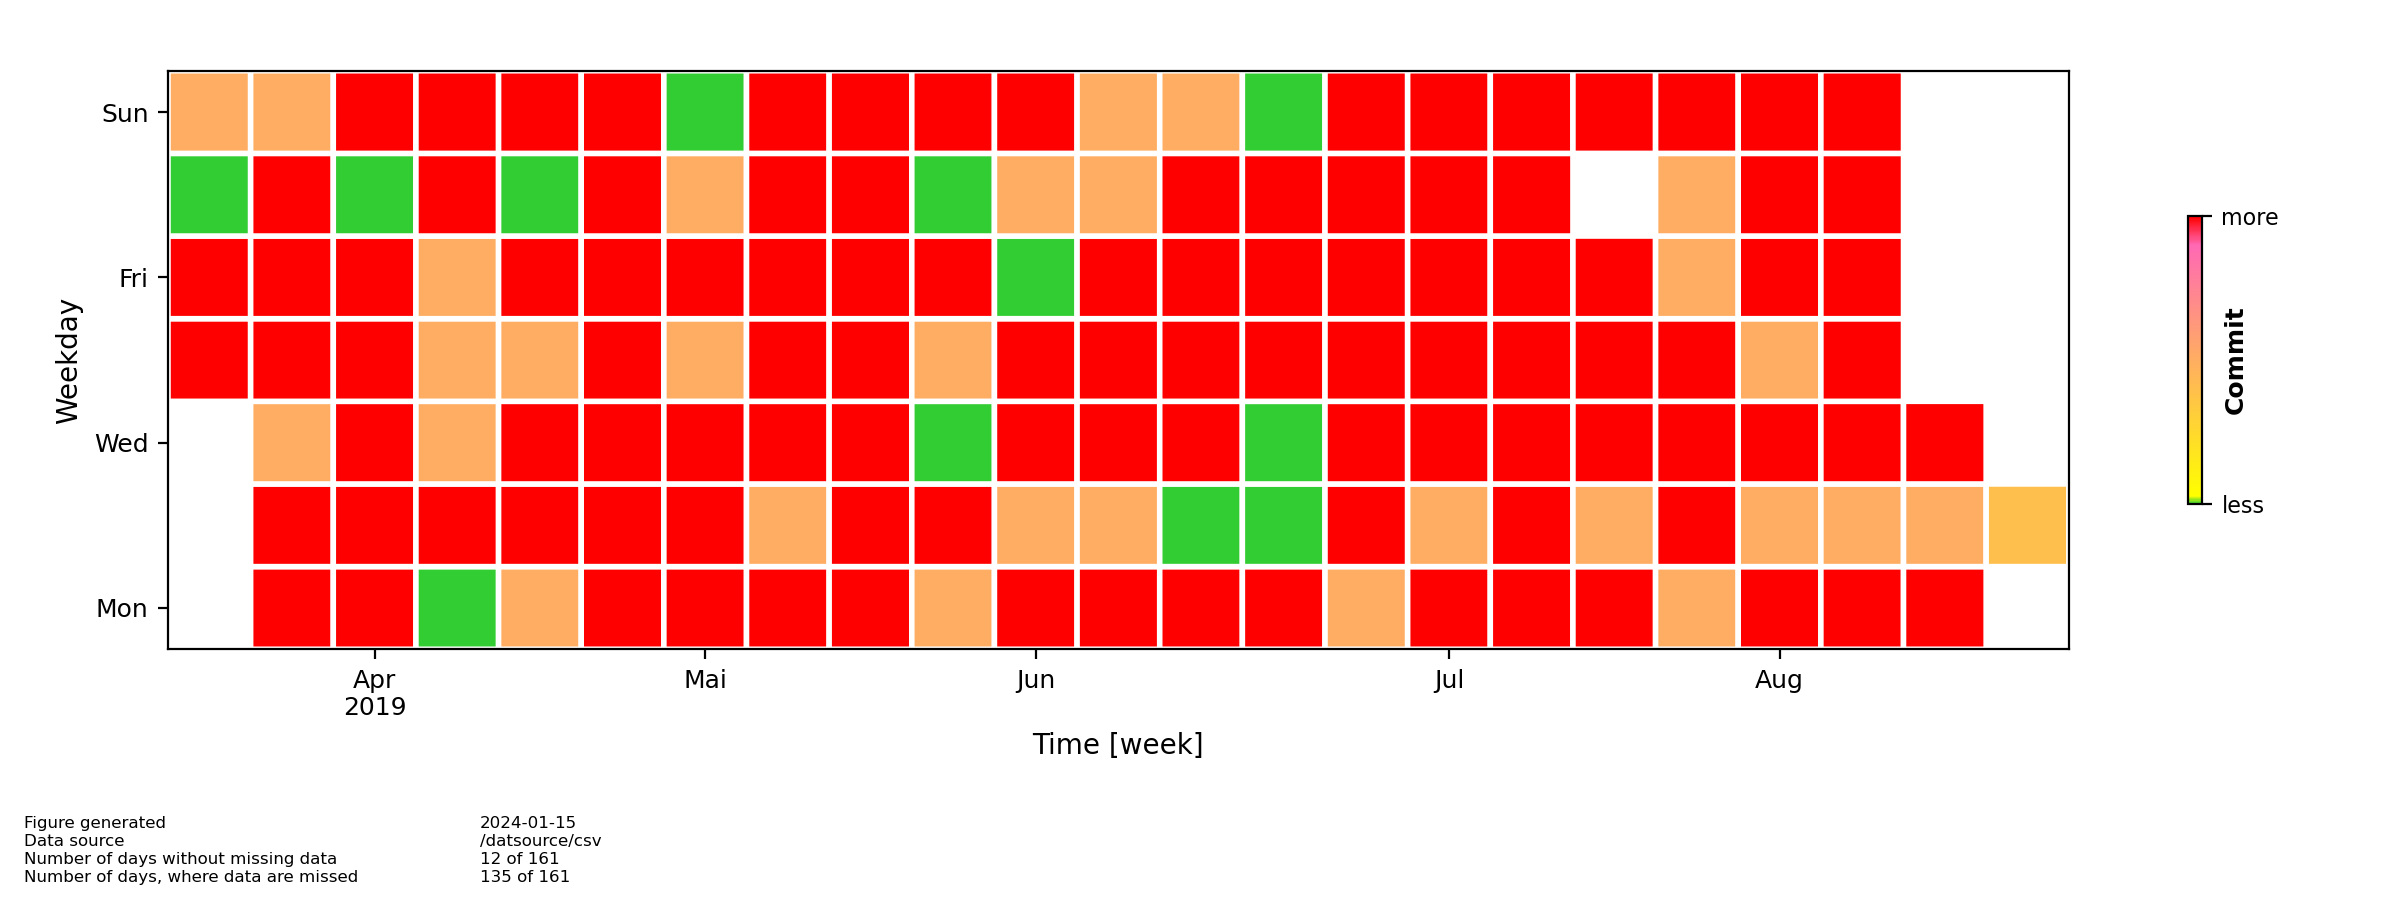
The repo contains a python3 module to visualize subjects (e.g. missing files) - hereafter refered as data - in a heatmap with daily resolution.
The repo contains a python3 module to visualize data in a heatmap with daily resolution.
The software package is written to visualize data similar to the
github contribution chart.
 Example 1: The provided data has a single entry (row) per day.
 Example 2: The provided data has muliple entries per day and a day can have no, a few or exclusiv missing files.
This package is not prepared for collecting the data. This package is prepared for visualization only.
Input
The data can be provided in two different ways:
- data_input_type = CSV as two column comma separated csv-file, with a single line header with the names of the columns
- the data column1 should be consists of a date or a datetime string
- the data column2 should be a float or a integer value
- recommendation: use value 0 if file is NOT missing and value 1 if file is missing
- e.g.:
date,missing files
2020-01-18 00:00:00, 1
2020-01-18 10:00:00, 1
2020-01-20 00:00:00, 0
2020-01-21, 1
2019-12-18 01:00:00, 0
2020-01-21 10:00:00, 0
2020-01-21 10:00:00, 0
2020-01-25 10:00:00, 1
2020-01-30 10:00:00, 0.5
- data_input_type = DataFrame as pandas DataFrame
- the values in the column1 'date' should be a dtype: datetime64[ns]
- the values in the second column shouls be float or integer
- recommendation: use value 0 if file is NOT missing and value 1 if file is missing
In general
- the provided data can contain gaps and
- the provided data can be un-sorted in terms of date or datetime.
- the title (e.g.: Missing files) at the colorbar displays the column(2of2) name of your DataFrame or your csv-file
Output
The script generates a Heatmap of missing files. The Heatmap will be provided
- as rendered png-file and additionally
- as html-file using the javascript highcharts library.
- Python version 3.x
- numpy
- pandas
- datetime
- platform
- os
- matplotlib
There are two options to take your data.
... see also python script plthtmp.py
import PlotHeatmap


# OPTION1: used data are imported from csv file
PlotHeatmap.main(
    {
    'data_import_type' : 'CSV', # Test|DataFrame|CSV
    'picture_filename' : 'test/mypic_testfile_csv',
    'csv_filename'     : 'test/test_missing_files.csv'
    }
)

# OPTION2: used data are provided as panda DataFrame
PlotHeatmap.main(
    {
    'data_import_type' : 'DataFrame', # Test|DataFrame|CSV
    'picture_filename' : 'test/mypic_external_dataframe',
    'DataFrame'        : df
    }
)
- Rico Hengst
 https://orcid.org/0000-0001-8994-5868
This application is free software, licensed under CC-BY-SA. The copyright (c) 2020 belongs to Rico Hengst.
