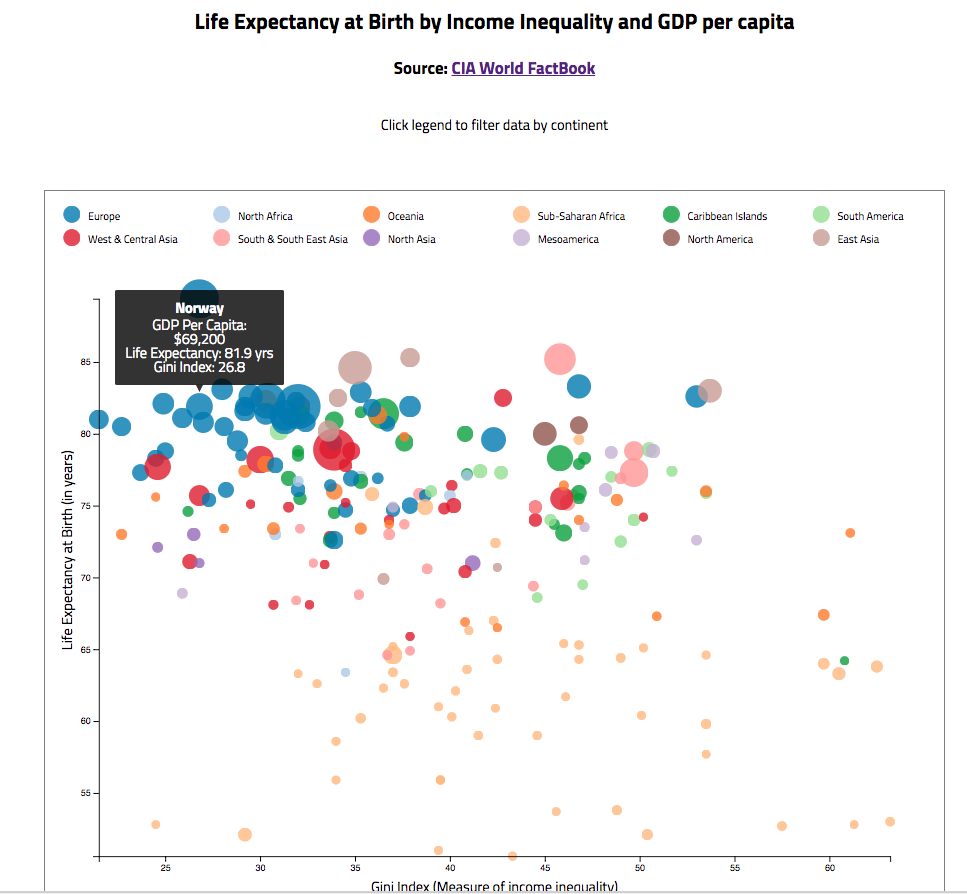
- I can see data visualized in a scatterplot graph.
- I can mouse over a plot to see a tooltip with additional details.
The recommended data source for this project (doping allegations in bicycle racing) was boring to me so I used a different one. This graph plots life expectancy at birth against income inequality (Gini coefficient) and GDP.
CIA Workld Factbook: https://www.cia.gov/library/publications/the-world-factbook/rankorder/rankorderguide.html
