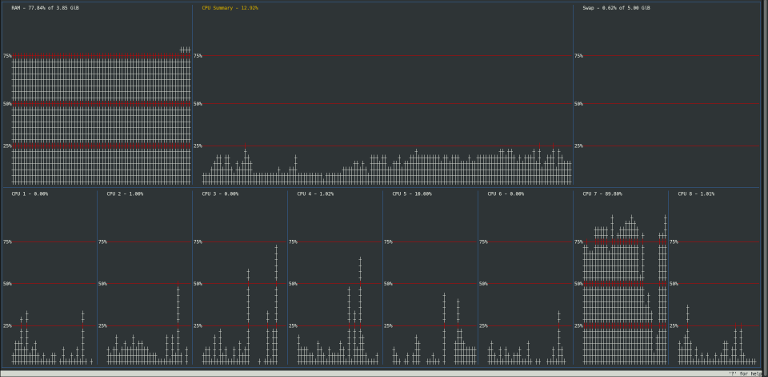
ttysys is a live ncurses cpu usage graph. The graph's units are in percentage. It updates once every second.
$ sudo apt install libncurses5-dev
$ make all
Build takes a dependency on libncurses5-dev. Simply sudo apt install libncurses5-dev for Debian/Ubuntu.
A simple make all should suffice. If you get errors using my makefile, see the Questions/Bugs section below.
$ make install
Running make install will copy the binary to /usr/local/bin. This should be in your path.
$ make uninstall
Running make uninstall will rm /usr/local/bin/ttysys.
$ ttysys [<sequence>]
sequence can consist of any number of the following characters:
?- Displays a help window.h- Split current window horizontally.v- Split current window vertically.c- Close current window.- Tab - Move to next window in order of creation.
- Arrow Keys - Move to next window on screen in direction pressed.
- Numbers
0-9and keysmands- Select a data source for a window.0will set the data source to a CPU overview, and1-9set it to a specific core.mwill set the data source to RAM usage.swill set the data source to Swap usage.
g- Toggle grid for selected window.e- Toggle value display in current window's title.t- Toggle display of current window's title bar.o- Toggle display of current window's ordinate label sidebar.q- Quit this program.u- Same as up arrow key. Move to window above current one.d- Same as down arrow key. Move to window below current one.l- Same as left arrow key. Move to window left of current one.r- Same as right arrow key. Move to window right of current one.
These same buttons will control the program while it is running.
It works by reading the first few lines in /proc/stat that begin with cpu.
man 5 proc explains the meaning of the contents of /proc/stat.
These lines tell you how much time each CPU spent in different states. The sum of each line is the total time spent for each CPU. I read this file twice with a second in between. Then, I subtract the two totals to have the total CPU time spent during my sleep(). Now, I add the user and system numbers together and divide by my difference. Finally, it's just a matter of displaying it nicely.
To check the RAM and Swap, I read the appropriate lines in /proc/meminfo. MemTotal, MemFree, Buffers, Cached, SwapTotal, and SwapFree are all the lines that ttysys reads. MemFree + Buffers + Cached is the amount of free RAM usually reported by other tools, so I conformed.
I will be sticking to the branching model described here. Pull requests should also stick to this branching model. Thanks.
Report A Bug
OR
Contact me at pi.rubiks@gmail.com
