CFGgrind is a valgrind plugin to reconstruct control flow graphs (CFGs) dynamically by following the execution of binary programs. This tools allows successive CFGs refinements by supporting multiple executions with different inputs. We support multi-thread programs with profiling information in the edges, calls and signal handlers. More details can be found in our paper published on Software, Practice & Experience.
To build CFGgrind, first download and unpack valgrind (3.23.0).
$ wget -qO - https://sourceware.org/pub/valgrind/valgrind-3.23.0.tar.bz2 | tar jxv
Then, enter directory and clone CFGgrind github repository. Apply the patch to add the tool in the compilation chain.
$ cd valgrind-3.23.0
$ git clone https://github.com/rimsa/CFGgrind.git cfggrind
$ patch -p1 < cfggrind/cfggrind.patch
Build valgrind with CFGgrind.
$ ./autogen.sh
$ ./configure
$ make -j4
$ sudo make install
Compile and use a test program that orders numbers given in the arguments list. We compile it here with debugging symbols, but it is not required.
$ cd cfggrind/tests
$ gcc -g -ggdb -O0 -Wall -fno-stack-protector -no-pie -o test test.c
$ ./test 15 4 8 16 42 23
4 8 15 16 23 42
First, get the assembly instructions mapping for better CFG visualization.
$ cfggrind_asmmap ./test > test.map
$ head -n 5 test.map
0x4004a8:4:sub $0x8,%rsp
0x4004ac:7:mov 0x200b45(%rip),%rax
0x4004b3:3:test %rax,%rax
0x4004b6:2:je 00000000004004bd <_init+0x15>
0x4004b8:5:callq 0000000000400540 <.plt.got>
Then, use the tool to generate an output file (test.cfg) that can be used later for CFG refinements. Also, generate a DOT file for the bubble function (cfg-0x{addr}.dot) with the instructions loaded from the map (test.map). For more information on the supported options use the --help switch.
$ valgrind -q --tool=cfggrind --cfg-outfile=test.cfg --instrs-map=test.map --cfg-dump=bubble ./test 4 8 15 16 23 42
4 8 15 16 23 42
Generate an image from the DOT file for the bubble function.
$ ls *.dot
cfg-0x400627.dot
$ dot -Tpng -o cfg-ordered.png cfg-0x400627.dot
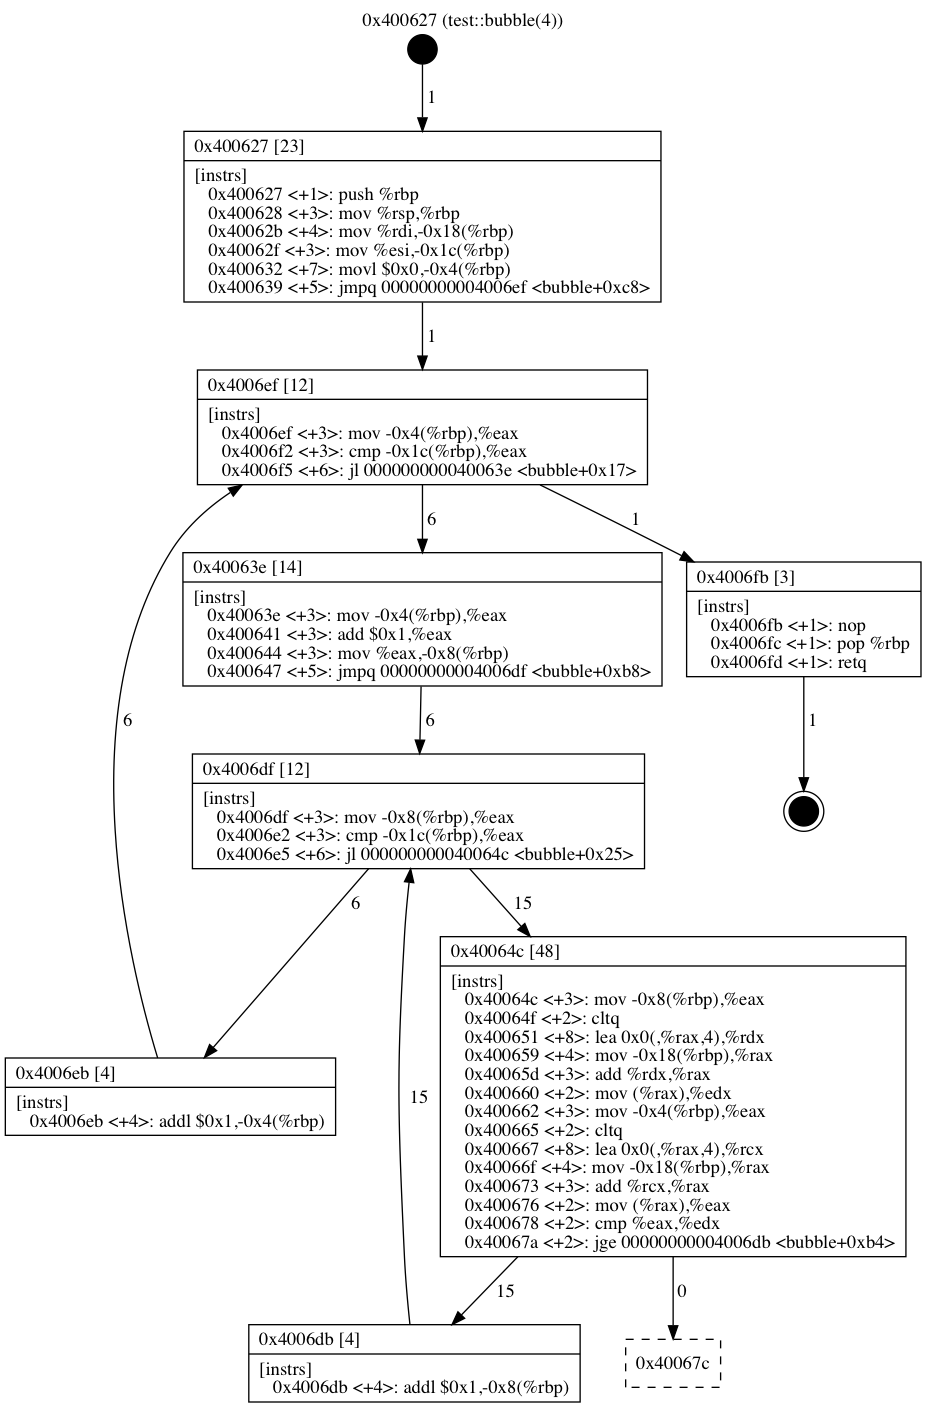
Since the list used in the arguments was ordered, there is a phantom node for the conditional not taken inside the double loop.
Use the same reference input (test.cfg) in a new execution with an unordered list as argument. Ignore the profiling information of the previous run to account only profiling for the next execution.
$ valgrind -q --tool=cfggrind --cfg-infile=test.cfg --cfg-outfile=test.cfg --instrs-map=test.map --ignore-profiling=yes --cfg-dump=bubble ./test 15 4 8 42 16 23
4 8 15 16 23 42
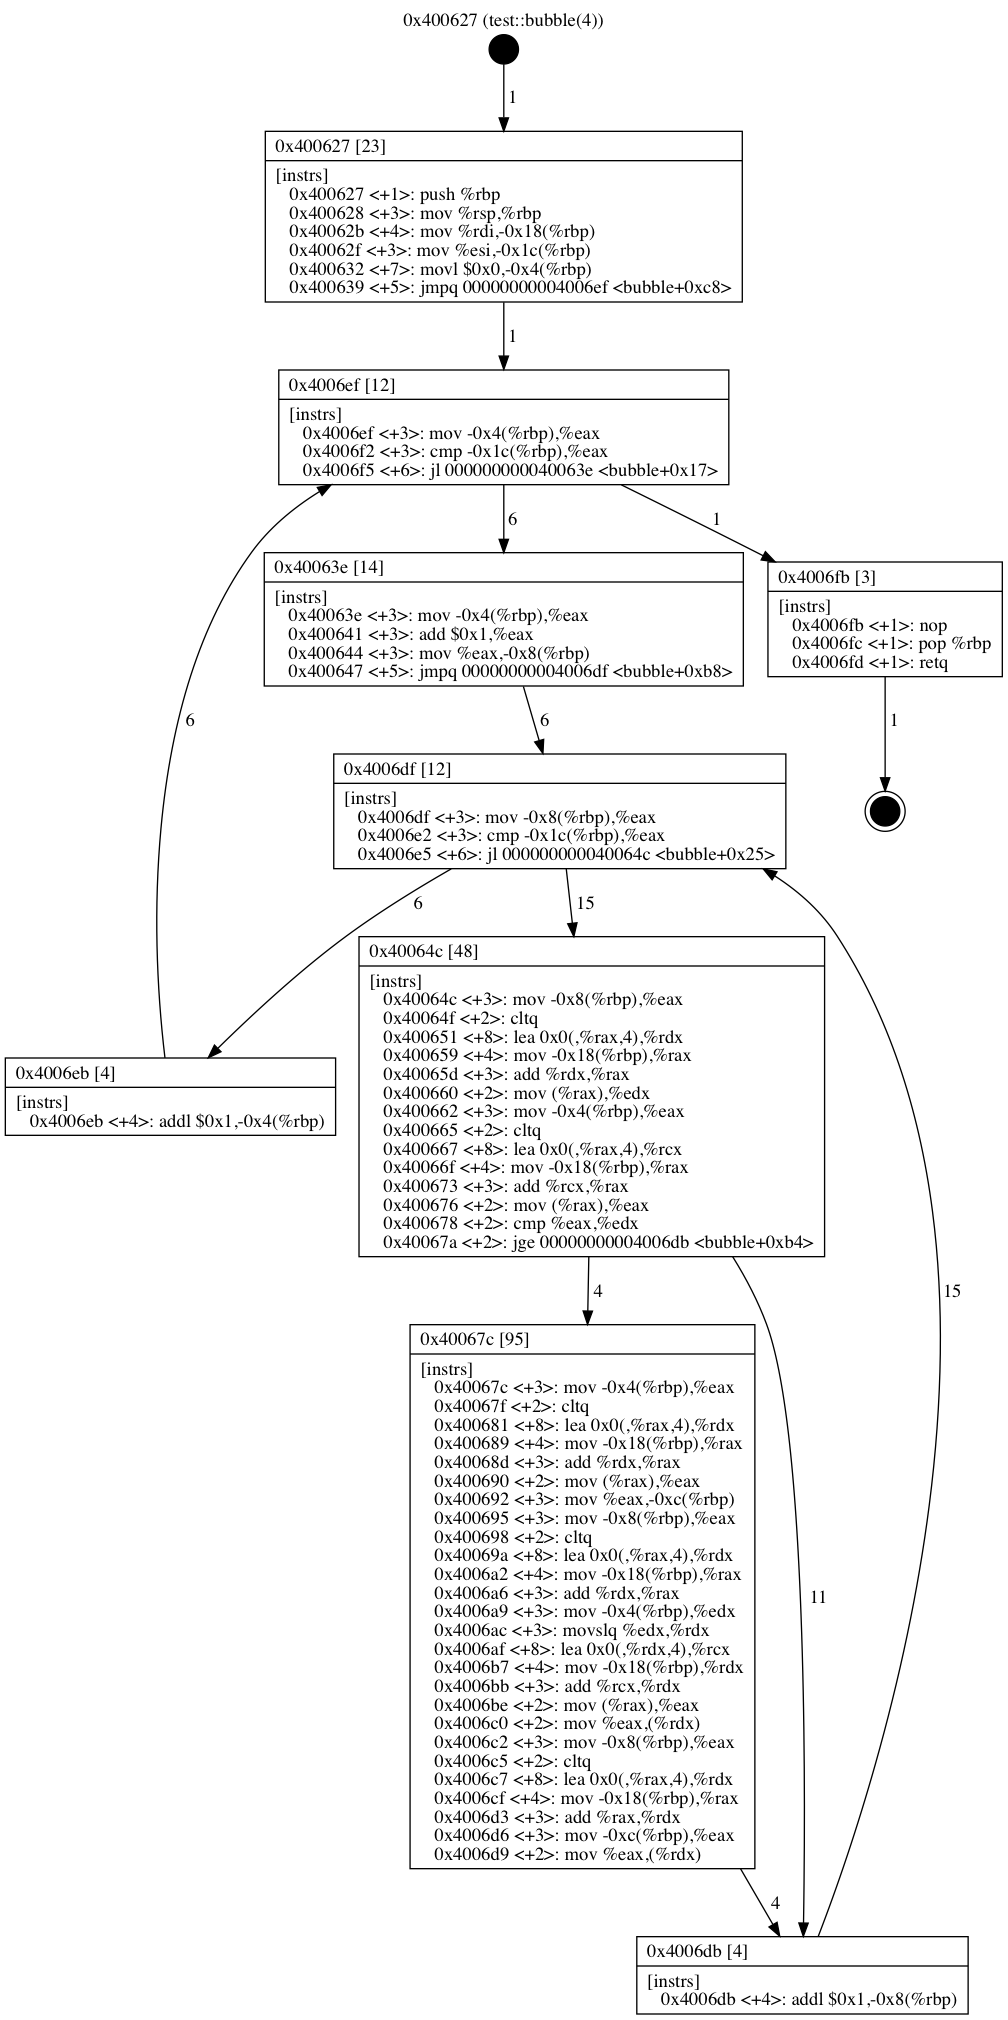
Update the image with the complete CFG now.
$ dot -Tpng -o cfg-unordered.png cfg-0x400627.dot
The output produced by CFGgrind can be used to extract statistics information from a program execution. The statistics is provided by cfggrind_info. This script that can be used to display information for the whole program or for functions. It can output the statistics in two formats: json and csv. The csv version does not output instructions opcode statistics.
To obtain the whole program statistics, run:
$ cfggrind_info -s program -i test.map -m json test.cfg
{
  "functions": 252,
  "complete": 28,
  "incomplete": 224,
  "blocks": 2872,
  "phantoms": 990,
  "edges": 4977,
  "static": {
    "instructions": {
      "count": 13177,
      "opcodes": {
        "unknown": 13012,
        "sub": 5,
        "mov": 51,
        "test": 1,
        "je": 3,
        "add": 8,
        "ret": 7,
        "jmp": 5,
        "shr": 1,
        "sar": 2,
        "push": 16,
        "bnd": 10,
        "xor": 3,
        "pop": 3,
        "and": 1,
        "call": 8,
        "cmp": 6,
        "cmpb": 1,
        "jne": 1,
        "movb": 1,
        "movl": 3,
        "jl": 4,
        "nop": 2,
        "cltq": 5,
        "lea": 8,
        "jge": 1,
        "addl": 4,
        "shl": 3,
        "movslq": 1,
        "leave": 1
      }
    },
    "calls": 417,
    "signals": 0
  },
  "dynamic": {
    "instructions": {
      "count": 148050,
      "opcodes": {
        "unknown": 147391,
        "sub": 5,
        "mov": 248,
        "test": 1,
        "je": 3,
        "add": 51,
        "ret": 7,
        "jmp": 10,
        "shr": 1,
        "sar": 2,
        "push": 16,
        "bnd": 10,
        "xor": 3,
        "pop": 3,
        "and": 1,
        "call": 18,
        "cmp": 58,
        "cmpb": 1,
        "jne": 1,
        "movb": 1,
        "movl": 3,
        "jl": 42,
        "nop": 2,
        "cltq": 43,
        "lea": 61,
        "jge": 15,
        "addl": 33,
        "shl": 13,
        "movslq": 6,
        "leave": 1
      }
    },
    "calls": 1113,
    "signals": 0
  }
}
To obtain statistics for functions, enable it with -s functions. When used alone, this option has the effect of displaying statistics for all functions. To view statistics for specific functions, combine it with the -f option. This option can be used with multiple function names expressed as regular expressions.
$ cfggrind_info -s functions -f "test::main" "test::bubble" -i test.map -m json test.cfg
[
  {
    "cfg": "0x4006de",
    "invoked": 1,
    "complete": true,
    "blocks": 13,
    "phantoms": 0,
    "exit": true,
    "halt": false,
    "edges": 16,
    "static": {
      "instructions": {
        "count": 67,
        "opcodes": {
          "push": 2,
          "mov": 30,
          "sub": 2,
          "cltq": 3,
          "shl": 3,
          "call": 6,
          "movl": 2,
          "jmp": 2,
          "cmp": 2,
          "jl": 2,
          "lea": 6,
          "add": 2,
          "movslq": 1,
          "addl": 2,
          "leave": 1,
          "ret": 1
        }
      },
      "calls": 6,
      "signals": 0
    },
    "dynamic": {
      "instructions": {
        "count": 248,
        "opcodes": {
          "push": 2,
          "mov": 107,
          "sub": 2,
          "cltq": 13,
          "shl": 13,
          "call": 16,
          "movl": 2,
          "jmp": 2,
          "cmp": 14,
          "jl": 14,
          "lea": 31,
          "add": 12,
          "movslq": 6,
          "addl": 12,
          "leave": 1,
          "ret": 1
        }
      },
      "calls": 16,
      "signals": 0
    },
    "name": "test::main(18)"
  },
  {
    "cfg": "0x400607",
    "invoked": 1,
    "complete": false,
    "blocks": 8,
    "phantoms": 1,
    "exit": true,
    "halt": false,
    "edges": 12,
    "static": {
      "instructions": {
        "count": 35,
        "opcodes": {
          "push": 1,
          "mov": 13,
          "movl": 1,
          "jmp": 2,
          "cmp": 3,
          "jl": 2,
          "add": 3,
          "nop": 1,
          "pop": 1,
          "ret": 1,
          "cltq": 2,
          "lea": 2,
          "jge": 1,
          "addl": 2
        }
      },
      "calls": 0,
      "signals": 0
    },
    "dynamic": {
      "instructions": {
        "count": 348,
        "opcodes": {
          "push": 1,
          "mov": 133,
          "movl": 1,
          "jmp": 7,
          "cmp": 43,
          "jl": 28,
          "add": 36,
          "nop": 1,
          "pop": 1,
          "ret": 1,
          "cltq": 30,
          "lea": 30,
          "jge": 15,
          "addl": 21
        }
      },
      "calls": 0,
      "signals": 0
    },
    "name": "test::bubble(4)"
  }
]
The output format, enabled by the --cfg-outfile argument, has two main formats: cfg and node. Optional sections in this format are marked with curly brackets.
A cfg must have an address (cfg-addr). If profiling is enabled at compile-time, this address can be followed by an optional number of invocations separated by a colon (:invocations). The cfg must have a function name (cfg-name) in double quotes. The name can be obtained from the debugging symbols if present, or marked as unknown otherwise. Finally, the cfg has a flag (is-complete) indicating if this CFG is complete -- it has no indirect jumps or calls, and it has no phantom nodes (nodes never executed during runtime).
[cfg cfg-addr{:invocations} cfg-name is-complete]
A node models a basic block with instructions, a list of function calls addresses, a list of signal ids that contains a list of calls handlers, a flag indicating if the last instruction of the node is an indirect jump or call, and a list of successors nodes (node address, exit or halt). A successor node with an unmapped address is a phantom node. Note that there is no special entry node in this representation. There is only a single/unique node that has the same address of its CFG that should be executed first in case of a invocation of this CFG.
[node cfg-addr node-addr node-size [list of instr-size] [list of cfg-addr{:count}]
      [list of signal-id->cfg-addr{:count}] is-indirect [list of succ-node{:count}]]
A node must belong to a CFG (cfg-addr) and it is identified by its starting node address (node-addr) and node size (node-size). Then, a node has a non-empty list of sizes for each of its instructions (list of instr-size) between brackets. The sum of the size of these instructions must add up to the node-size. The node has a list of called functions, where each function is index by the address of its CFG followed by an optional invocation count (list of cfg-addr{:count}). This list is empty if there are no function calls for this node. Also, the node has a mapping of called signal handlers indexed by the signal id (signal-id). Each signal is thus mapped to a CFG (->cfg-addr) followed by an optional invocation count ({:count}). Similarly, this list is empty if no signal handlers are activated by this node. The node contains a marker if the tail instruction does an indirect jump or call (is-indirect). Finally, the node has a list of successor nodes (list of succ-node), where each node (succ-node) is an address, exit or halt. These successor nodes can be followed, optionally, by its execution counts.
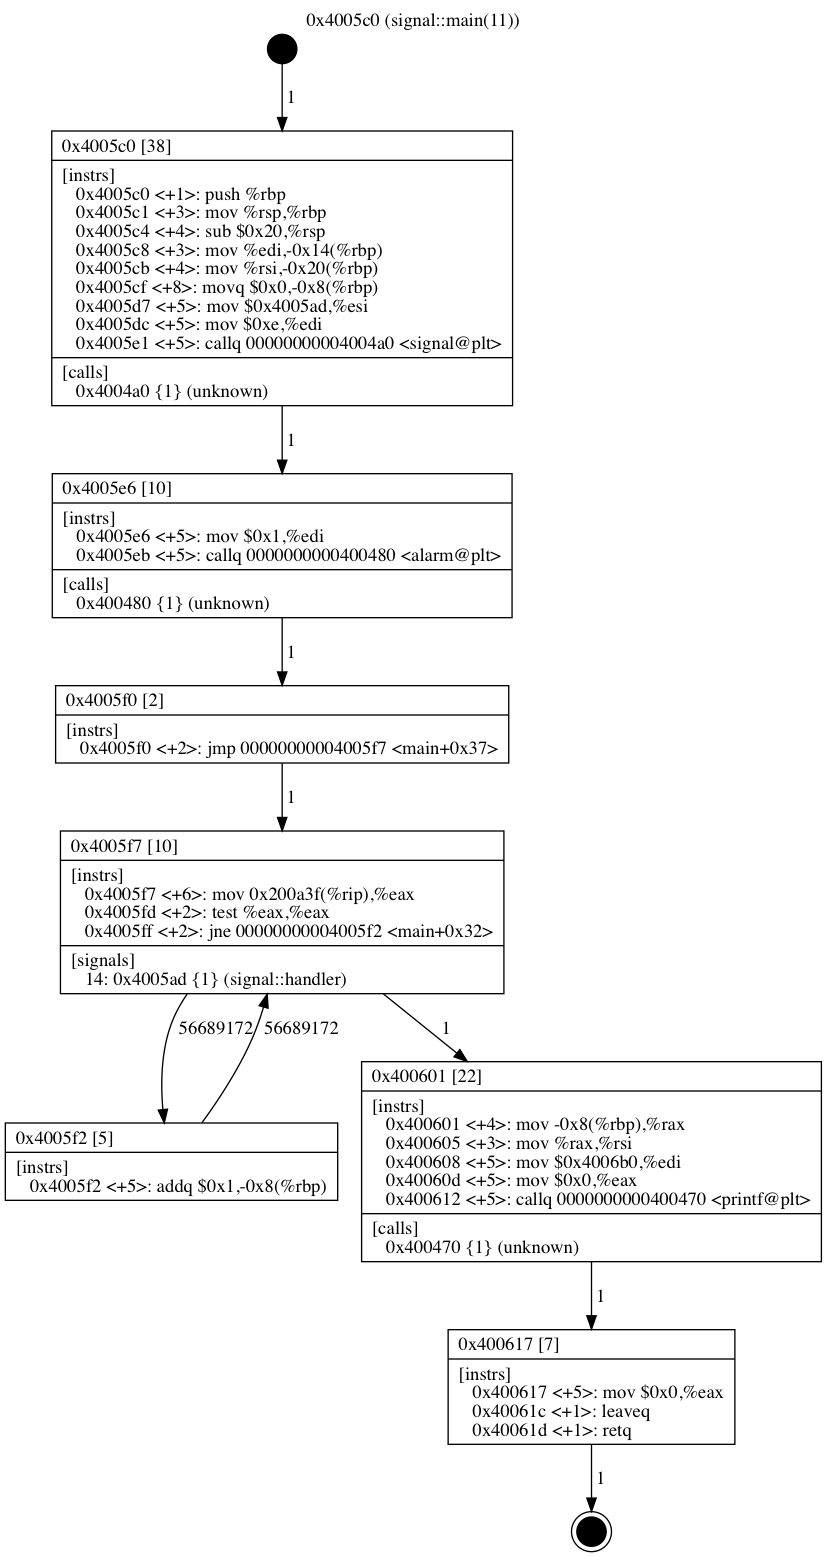
For example, the main function of file tests/signal.c can be represented as:
[cfg 0x4005c0:1 "signal::main(11)" true]
[node 0x4005c0 0x4005c0 38 [1 3 4 3 4 8 5 5 5] [0x4004a0:1] [] false [0x4005e6:1]]
[node 0x4005c0 0x4005e6 10 [5 5] [0x400480:1] [] false [0x4005f0:1]]
[node 0x4005c0 0x4005f0 2 [2] [] [] false [0x4005f7:1]]
[node 0x4005c0 0x4005f7 10 [6 2 2] [] [14->0x4005ad:1] false [0x4005f2:56689172 0x400601:1]]
[node 0x4005c0 0x4005f2 5 [5] [] [] false [0x4005f7:56689172]]
[node 0x4005c0 0x400601 22 [4 3 5 5 5] [0x400470:1] [] false [0x400617:1]]
[node 0x4005c0 0x400617 7 [5 1 1] [] [] false [exit:1]]


