This project classifies real and simulated marine environment images using a deep learning approach. The workflow includes data collection, preprocessing, training a ResNet-18 model, and evaluating its performance. Key metrics such as accuracy, precision, recall, and F1 score are analyzed. Misclassified images are also logged for further insights.
- Synthetic Images: The SimuShips Dataset, stored in the
data/syntheticfolder. Total 9471 images. - Real Images:
- Marine Obstacle Detection Dataset (MODD): Used for training and validation. Stored in subfolders under
data/real/{}/images. Dataset link. Total 4454 images. - MaSTr1325 Dataset: Used for testing only. Stored in
data/test/real/MaSTr1325_images_512x384. Dataset link. Total 1325 images.
- Marine Obstacle Detection Dataset (MODD): Used for training and validation. Stored in subfolders under
- The data is split into training and validation sets with an 80-20 ratio.
- Due to imbalance in the number of synthetic and real images, I chose to use Weighted Cross-Entropy Loss
- Images are resized to 224x224 pixels while maintaining the original aspect ratio.
- Images are padded to ensure uniform dimensions.
- Normalization is applied using ImageNet statistics (
mean = [0.485, 0.456, 0.406],std = [0.229, 0.224, 0.225]). - Class labels:
0: Synthetic images1: Real images
-
Model: Pre-trained ResNet-18 from torchvision.
- Pre-trained on the ImageNet-1k dataset. This dataset includes classes related to ships and boats, thus, making it a suitable base model for the required task.
- Relevant ImageNet classes include container ships, speedboats, and ocean liners.
- 510: 'container ship, containership, container vessel',
- 628: 'liner, ocean liner',
- 724: 'pirate, pirate ship',
- 814: 'speedboat',
- And others related to watercraft
- Reference for ResNet-18: PyTorch ResNet-18 Documentation.
- Relevant ImageNet classes include container ships, speedboats, and ocean liners.
- Pre-trained on the ImageNet-1k dataset. This dataset includes classes related to ships and boats, thus, making it a suitable base model for the required task.
-
Modifications:
- The final fully connected layer is replaced to classify between two classes: real vs synthetic.
- Loss Function: Weighted Cross-Entropy Loss to address class imbalance.
- Optimizer: Adam with a learning rate of
0.001. - Early Stopping: Stops training if validation accuracy does not improve for a set number of epochs.
- Configurable parameters:
--batch_size: Batch size (default: 32)--epochs: Number of training epochs (default: 10)--learning_rate: Learning rate for the optimizer (default: 0.001)
- Metrics:
- Accuracy
- Precision
- Recall
- F1 Score
- Logging:
- Misclassified image paths are saved for further analysis.
- Train and val related metrics are also stored in
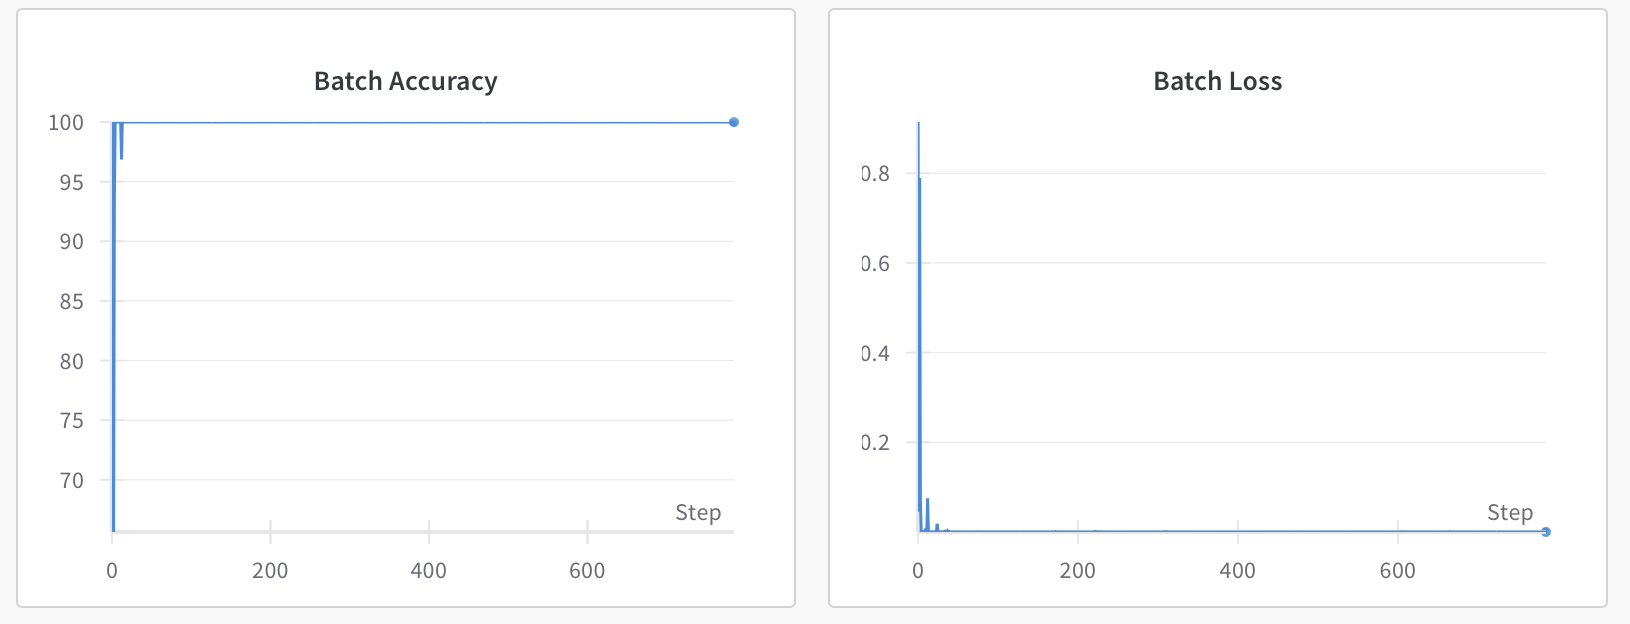
logs/train_{date}_{time}/training.txtduring training. - All results are visualized using Weights & Biases (wandb).
Ran a training experiment on 2024-12-02. The best saved model is models/best_model_20241202_021403.pth
-
Final Metrics:
- Metrics on both test and validation data:
- Accuracy:
100% - Precision:
1.00 - Recall:
1.00 - F1 Score:
1.00
- Accuracy:
- Metrics on both test and validation data:
-
Visualization:
- Training and validation loss trends.
- Misclassified image logs in every epoch while training, are saved in
logs/train_{date}_{time}/failed_val_epoch{}.txt. - Misclassified image logs during test, are saved in
logs/failed_test_model_{model_name}.txt.
- Python 3.9
- Docker or Conda for environment setup
- Build the Docker image:
docker build -t real-vs-simulated . - Run the container:
docker run -it real-vs-simulated
- Create the environment:
conda env create -f conda.yaml
- Activate the environment:
conda activate dev
Run the training script from the src folder:
python train.py --dataset_path ../data --batch_size 32 --epochs 10 --learning_rate 0.001Run the evaluation script:
python test.py --dataset_path ../data/test --model_path ../models/best_model_20241202_021403.pth- Used wandb for real-time monitoring and visualization of:
- Loss
- Accuracy
- Precision
- Recall
- F1 Score
- Paths of misclassified images are saved in
logs/failed_test_model_<model_name>.txt. - Observation:
- The model might overfit, potentially learning camera-specific intrinsics/extrinsics instead of generalized features. Better performance could be achieved with datasets ensuring similar camera properties for both real and simulated images.
