Build Interactive Web Dashboard for Exploring Belly Button Biodiversity Data using Plotly.js, Javascript and D3.js
Goals • Dataset • Tools Used • Analysis and Challenges
Utilize JavaScript, Plotly, and D3.js to build the following visualizations:
- horizontal bar chart to display the top 10 bacterial species (OTUs) when an individual’s ID is selected from the dropdown menu on the webpage
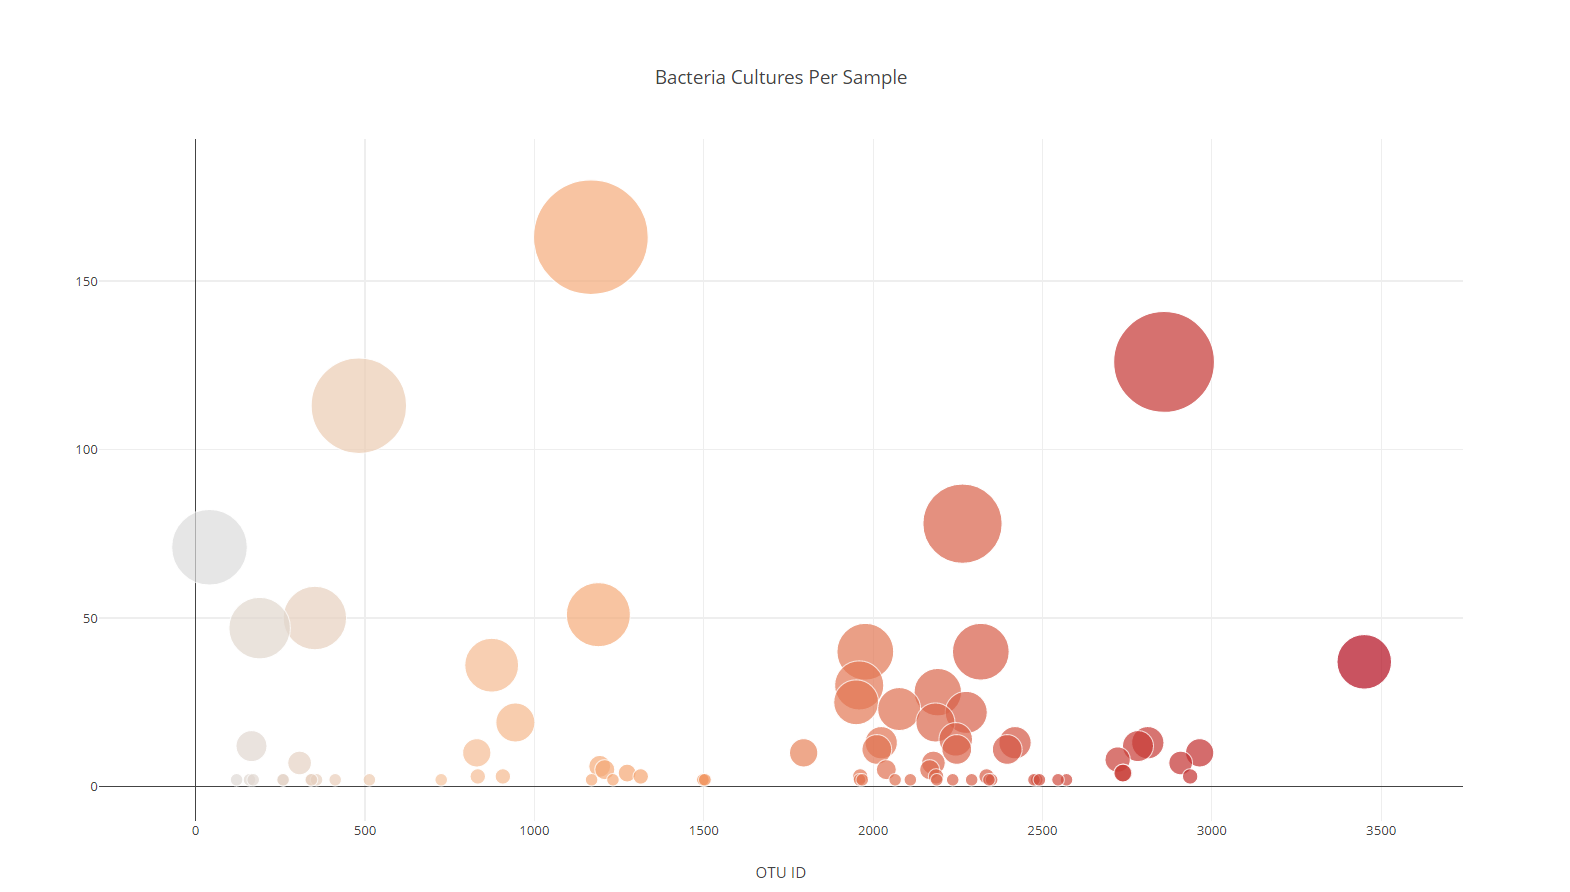
- bubble chart that will display the following when an individual’s ID is selected from the dropdown menu webpage
- gauge chart that displays the weekly washing frequency's value, and display the value as a measure from 0-10 on the progress bar in the gauge chart when an individual ID is selected from the dropdown menu
- Belly Button Data: JSON file containing belly button biodiversity data
- Javascript: Programming language used for creating visually appealing and dynamic web content
- Plotly.js: Javascript library used to create engaging and dynamic charts
- D3.js: Javascript library used for data visualization, reading JSON files and placing API calls
- HTML: Hypertext Markup Language used to build and design webpages
- CSS: Creative Style Sheets add dynamic visual styling to html webpages
Using Javascript, we built a javascript function in our charts.js file that compiled data from samples.json, and through the following plotly CDN generated the descriptive charts below:
<script src="https://cdn.plot.ly/plotly-latest.min.js"></script>


