-
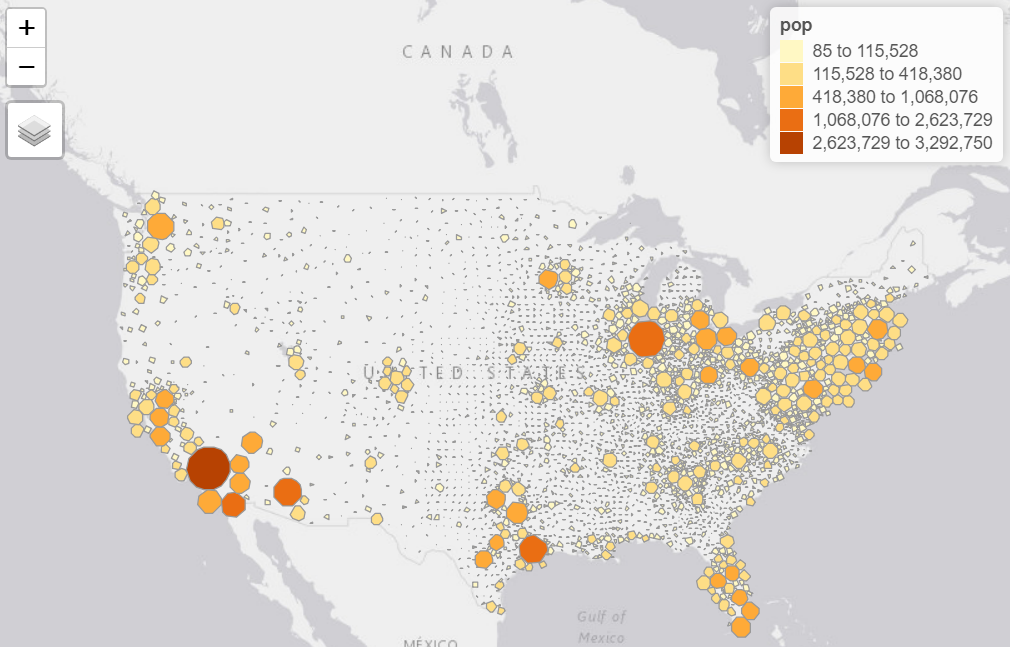
COVID & Elections Has there been a correlation between political party and infection rates?
-
Drawing wih R Given an image (jpg), can R return the graphic as circles or lines
-
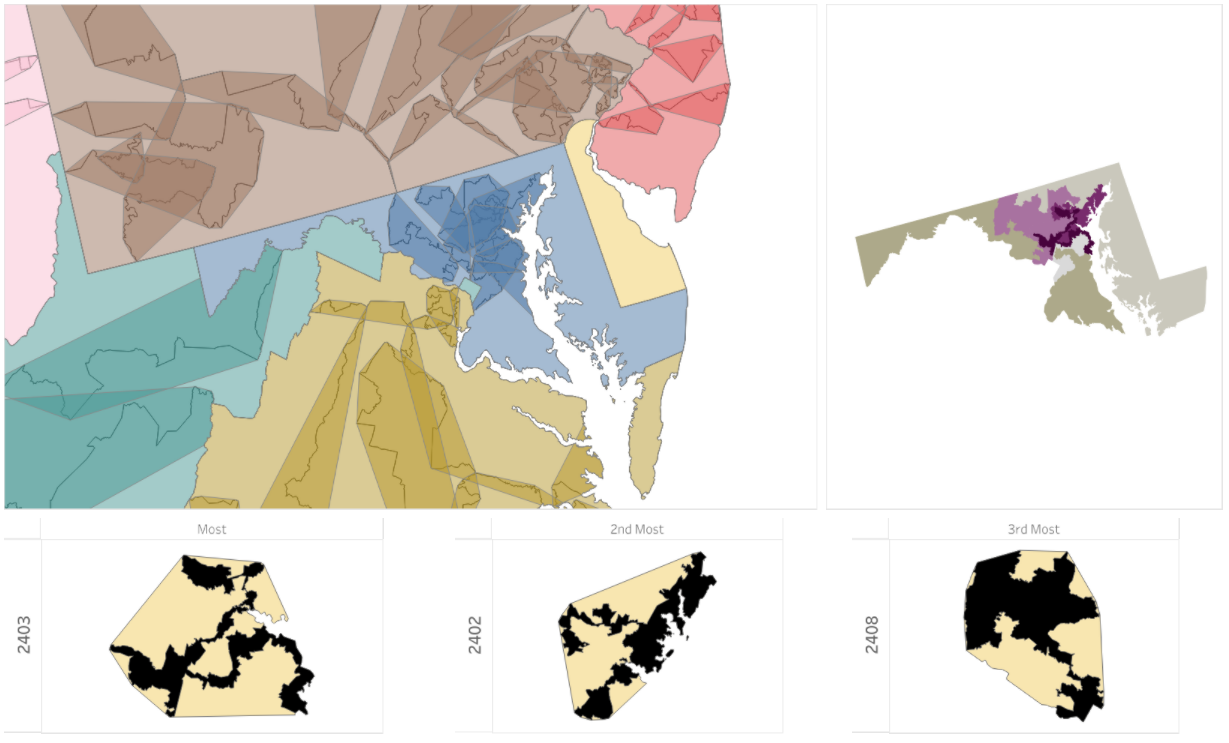
Gerrymandering While there is no great way to identify in an area is gerrymandered, I looked at concave hulls for congressional districts and the overlapping areas shared with other districts. This analysis provides the data for this Tableau dashboard
-
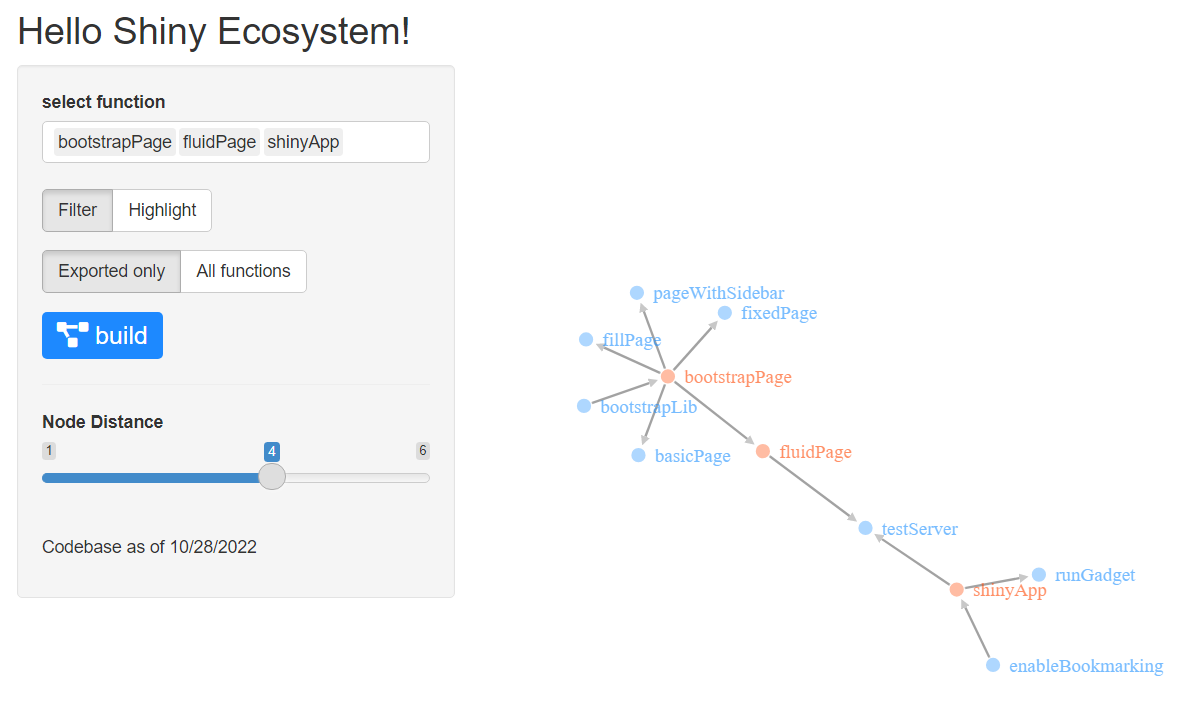
Shiny codebase (
codeapp) an overview of the shiny codebase as a network graph. This builds off the package dependency code stored here -
Find good datasets (
codeapp) helps identify data that would be useful for reproducible examples
-
COVID confidence intervals While the # of cases is subject to testing or a person being symptomatic enough to seek medical care, the number of deaths due to COVID hashigher accuracy. Making some assumptions about the 2% infection rate and a 3 week lag between a positive test result and death can we make estimates about the true number of cases in the United States? What are the confidence intervals?
-
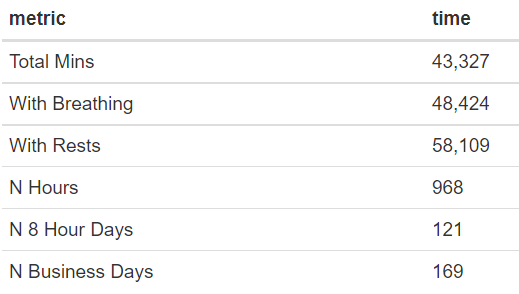
Counting to 1,000,000 How long would it take to count out-loud from 1 to 1 million? (see html)
-
Glasses This app helps me find frames on zenni.com. The dashboard can be seen here
-
Resume Written with R/LaTeX
-
Wordle - the best words to start out with if you want to try as many letters out as quick as you can
-
Scrabble Two questions, what two-letter words are easiest to work with? 'at' and 'la' are a good start. What seven letter word can have 1 letter removed each time to return a single letter? Not something you'd do in scrabble, but the answer to the riddle is planets > planet > plane > lane > lan > la > a)
-
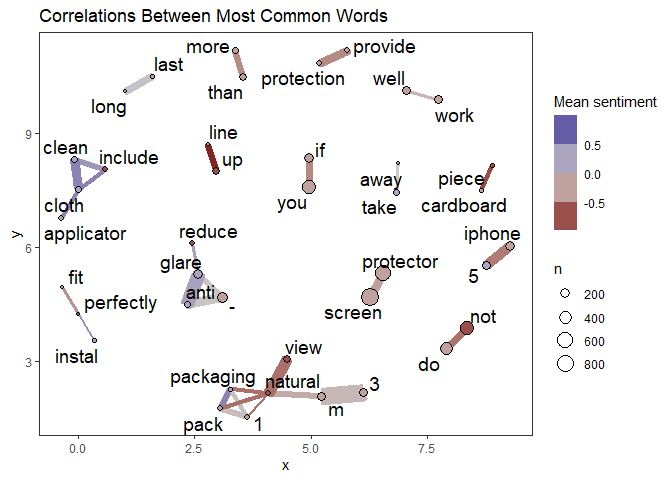
Text - Sentiment Analysis This is a templated script I put together for someone to get started with sentiment analysis. It uses
spacyrandreticulatefor some of the lemmanization and part-of-speech tagging ( overview, script ) -
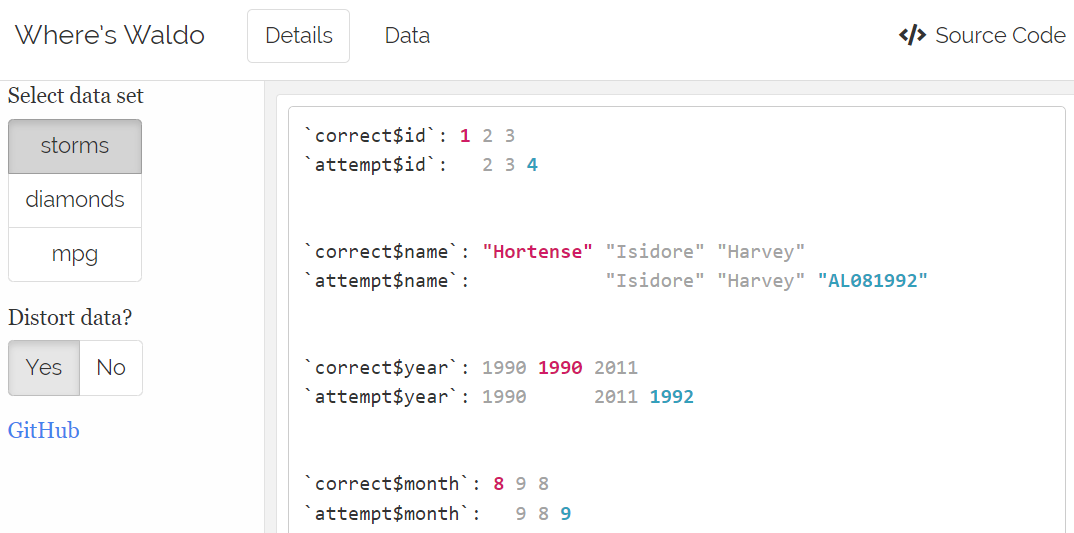
Where's Waldo A proof-of-concept dashboard using
waldo::compare()with and thefansipackage to mimic the colorful display R shows in the console.

