uptime
A remote monitoring application using Node.js, MongoDB, and Twitter Bootstrap.
You can watch a demo screencast on Vimeo.
Features
- Monitor thousands of websites (powered by Node.js asynchronous programming)
- Tweak frequency of monitoring on a per-check basis, up to the second
- Receive on screen notifications whenever a check goes down (powered by socket.io)
- Receive email notifications whenever a check goes down
- Record availability statistics for further reporting (powered by MongoDB)
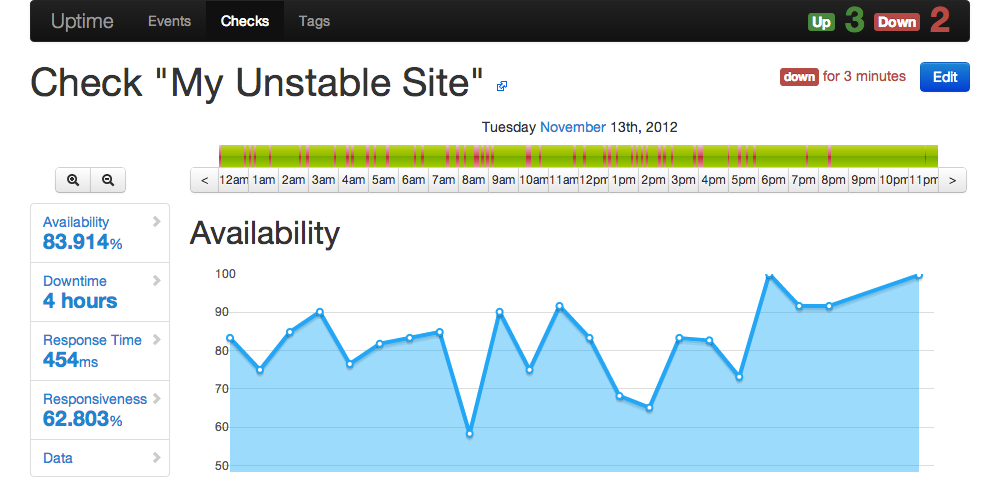
- Detailed uptime reports with animated charts (powered by Flotr2)
- Monitor availability, responsiveness, average response time, and total uptime/downtime
- Get details about failed checks (HTTP error code, etc.)
- Group checks by tags and get reports by tag
- Familiar web interface (powered by Twitter Bootstrap 2.0)
- Complete API for integration with third-party monitoring services
- Easy installation and zero administration
Installing Uptime
Uptime 3.0 requires Node.js 0.8 (if you're stuck with Node 0.6, try Uptime v1.4, available as a tag and on npm) and MongoDB 2.1.
To install from GitHub, clone the repository and install dependencies using npm:
> git clone git://github.com/fzaninotto/uptime.git
> cd uptime
> npm install
Lastly, start the application with:
> node app.js
Upgrading From a 2.0 Install
If you have been using uptime 1.0 or 2.0, you have to execute the migration script before using the new release.
> node models/migrations/upgrade2to3
Adding Checks
By default, the web UI runs on port 8082, so just browse to
http://localhost:8082/
And you're ready to begin. Create your first check by entering an URL, wait for the first ping, and you'll soon see data flowing through your charts!
Configuring
Uptime uses node-config to allow YAML configuration and environment support. Here is the default configuration, taken from config/default.yaml:
mongodb:
  server:   localhost
  database: uptime
  user:     root
  password:
  connectionString:       # alternative to setting server, database, user and password separately

monitor:
  name:                   origin
  apiUrl:                 'http://localhost:8082/api' # must be accessible without a proxy
  pollingInterval:        10000      # ten seconds
  timeout:                5000       # five seconds
  userAgent:              NodeUptime/2.0 (https://github.com/fzaninotto/uptime)

analyzer:
  updateInterval:         60000      # one minute
  qosAggregationInterval: 600000     # ten minutes
  pingHistory:            8035200000 # three months

autoStartMonitor: true

server:
  port:     8082
To modify this configuration, create a development.yaml or a production.yaml file in the same directory, and override just the settings you need. For instance, to run Uptime on port 80 in production, create a production.yaml file as follows:
server:
  port:     80
Node that Uptime works great behind a proxy - it uses the http_proxy environment variable transparently.
Monitoring From Various Locations
Heavily browsing the web dashboard may slow down the server - including the polling monitor. In other terms, using the application can influence the uptime measurements. To avoid this effect, it is recommended to run the polling monitor in a separate process.
To that extent, set the autoStartMonitor setting to false in the production.yaml, and launch the monitor by hand:
> node monitor.js &
> node app.js
You can also run the monitor in a different server. This second server must be able to reach the API of the dashboard server: set the monitor.apiUrl setting accordingly in the production.yaml file of the monitor server.
You can even run several monitor servers in several datacenters to get average response time. In that case, make sure you set a different monitor.name setting for all monitor servers to be able to tell which server make a particular ping.
Using Plugins
Uptime provides plugins that you can enable to add more functionality.
To enable plugins, create a plugins/index.js module. This module must offer a public init() method, where you will require and initialize plugin modules. For instance, to enable only the console plugin:
// in plugins/index.js
exports.init = function() {
  require('./console').init();
}
Currently supported plugins:
console: log pings and events in the console in real timeemail: notify events (up, down pause) by email
You can customize plugins using the YAML configuration.
You can add your own plugins under the plugins directory. A plugin is simply a module with a public init() method. For instance, if you had to recreate a simple version of the console plugin, you could write it as follows:
// in plugins/console/index.js
var CheckEvent = require('../../models/checkEvent');
exports.init = function() {
  CheckEvent.on('afterInsert', function(checkEvent) {
    checkEvent.findCheck(function(err, check) {
      console.log(new Date() + check.name + checkEvent.isGoDown ? ' goes down' : ' goes back up');
    });
  });
}
All Uptime entities emit lifecycle events that you can listen to on the Model class. These events are beforeInsert, afterInsert, beforeUpdate, afterUpdate, beforeSave (called for both inserts and updates), afterSave (called for both inserts and updates), beforeRemove, and afterRemove. For more information about these events, check the mongoose-lifecycle plugin.
Support and Discussion
Join the node-uptime Google Group to discuss features, bugs and use cases related to Uptime.
License
The Uptime code is free to use and distribute, under the MIT license.
Uptime uses third-party libraries:
- NodeJS, licensed under the MIT License,
- Socket.io, licensed under the MIT License,
- MongooseJS, licensed under the MIT License,
- jQuery, licensed under the MIT License,
- TwitterBootstrap, licensed under the Apache License v2.0,
- Flotr2, licensed under the MIT License.
- Favicon, distributed under the Free Art License.
If you like the software, please help improving it by contributing PRs on the GitHub project!
TODO
- Account for scheduled maintenance (and provide two QoS calculations: with and without scheduled maintenance)
- Allow for JavaScript execution in the monitored resources by using a headless browser (probably zombie.js)
- Unit tests
