Used Python3.8 to populate the influxDB database named system, psutil python library to get the
system informations.
The sample code is shown here:
from datetime import date, datetime
from time import sleep
from influxdb import InfluxDBClient
import psutil

client = InfluxDBClient()
client.create_database('system')
client.switch_database('system')

def get_points():
    points = [
        {
            "measurement": "cpu",
            "tags": {
                "machine":'bullst'
            },
            "time": datetime.utcnow().isoformat('T')+'Z',
            "fields": {
                "cpu_load":psutil.cpu_percent()
            }
        },
        {
            "measurement": "ram",
            "tags": {
                "machine":'bullst'
            },
            "time": datetime.utcnow().isoformat('T')+'Z',
            "fields": {
                "ram_usage":psutil.virtual_memory().percent
            }
        }
    ]
    return points

while True:
    client.write_points(get_points())
    client.write_points(get_points())
    sleep(1)
This Python API will create two measurements named cpu, ram. Also, it keeps updating the status of cpu, ram(usage in %) every 1s.
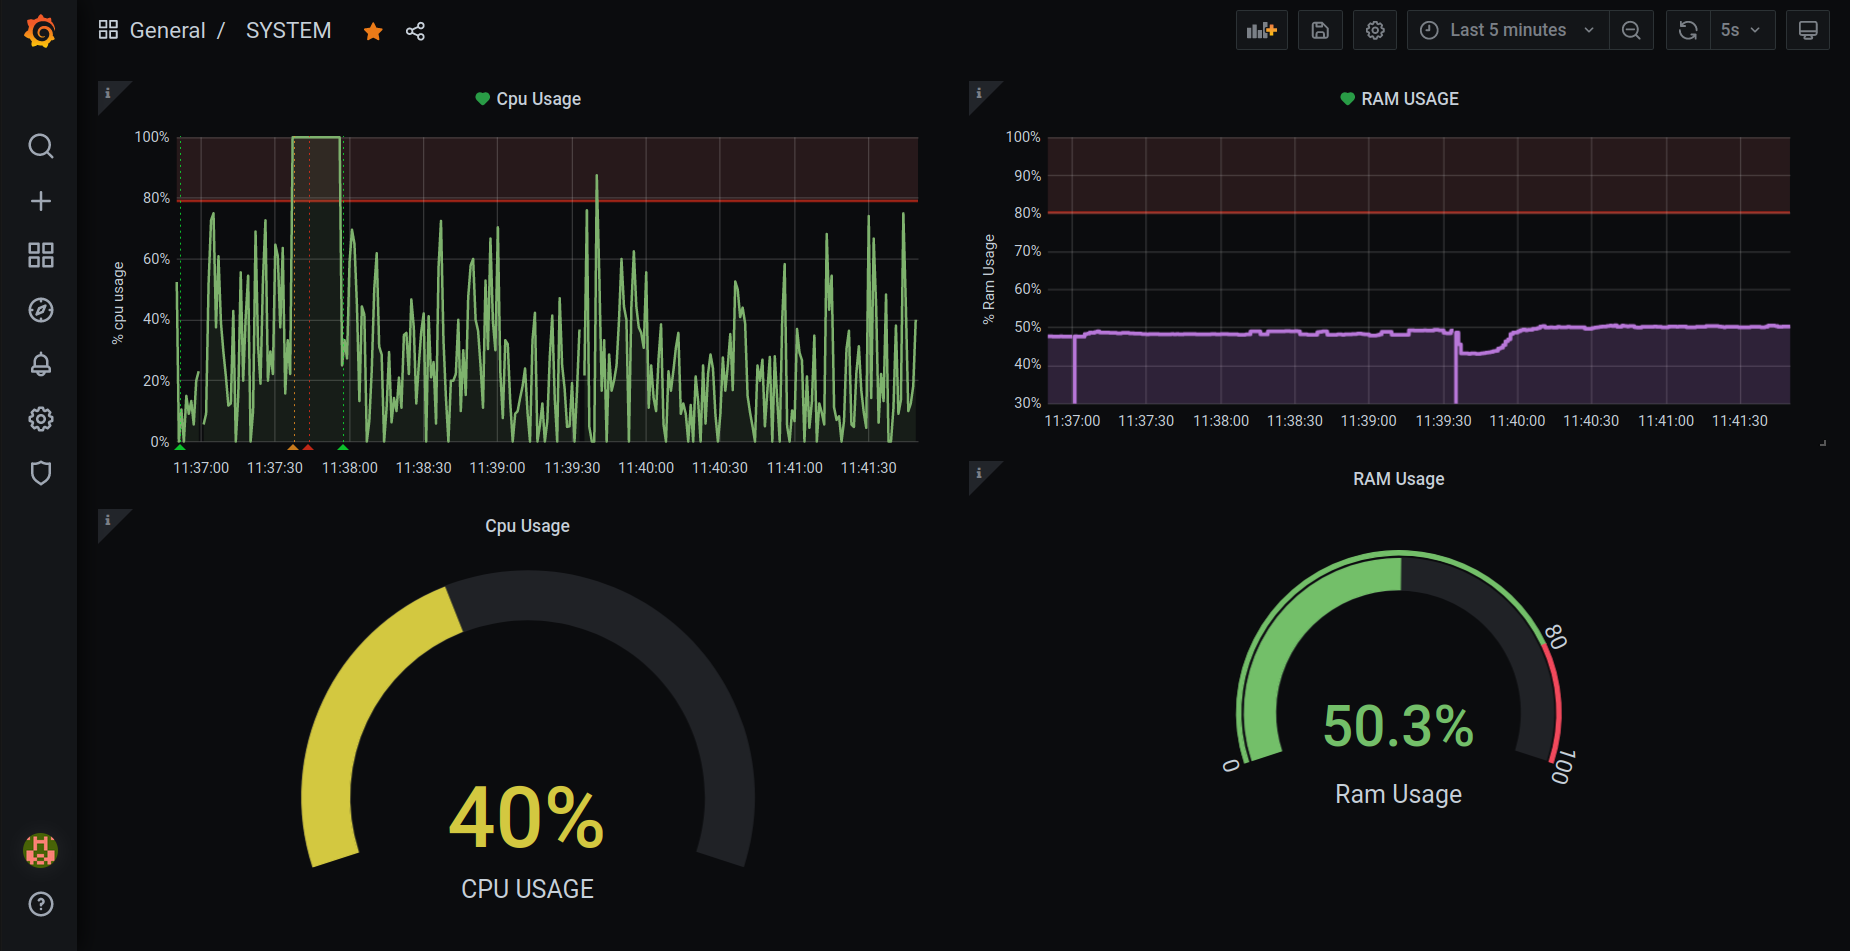
The sample snapshot of grafana dashboard is here:

Step1: Run grafana-server:
sudo service grafana-server start
Step2: Run influxDB server:
sudo service influxdb start
The above steps for ubuntu21.04 for windows/docker follow grafana-docs.
Save the python code in filename populate.py
On the terminal run:
python3 populate.py
Visit to the (https://localhost:3000) to see the dashboard, you have to import the json file from system.json.
On grafana setup datasource to influxDB and database to system.
To get an alert
--get an cpu alert
On the terminal run the following command(It'll lead to cpu usage of 100%):
stress --cpu 8 --timeout 20
--get an ram usage alert
On the terminal run the following command(It'll lead to ram usage of 3gb):
stress --vm 1 --vm-bytes 3G --vm-keep -t 20s
Change the 3G to other value depending on your system to reach 80% usage.
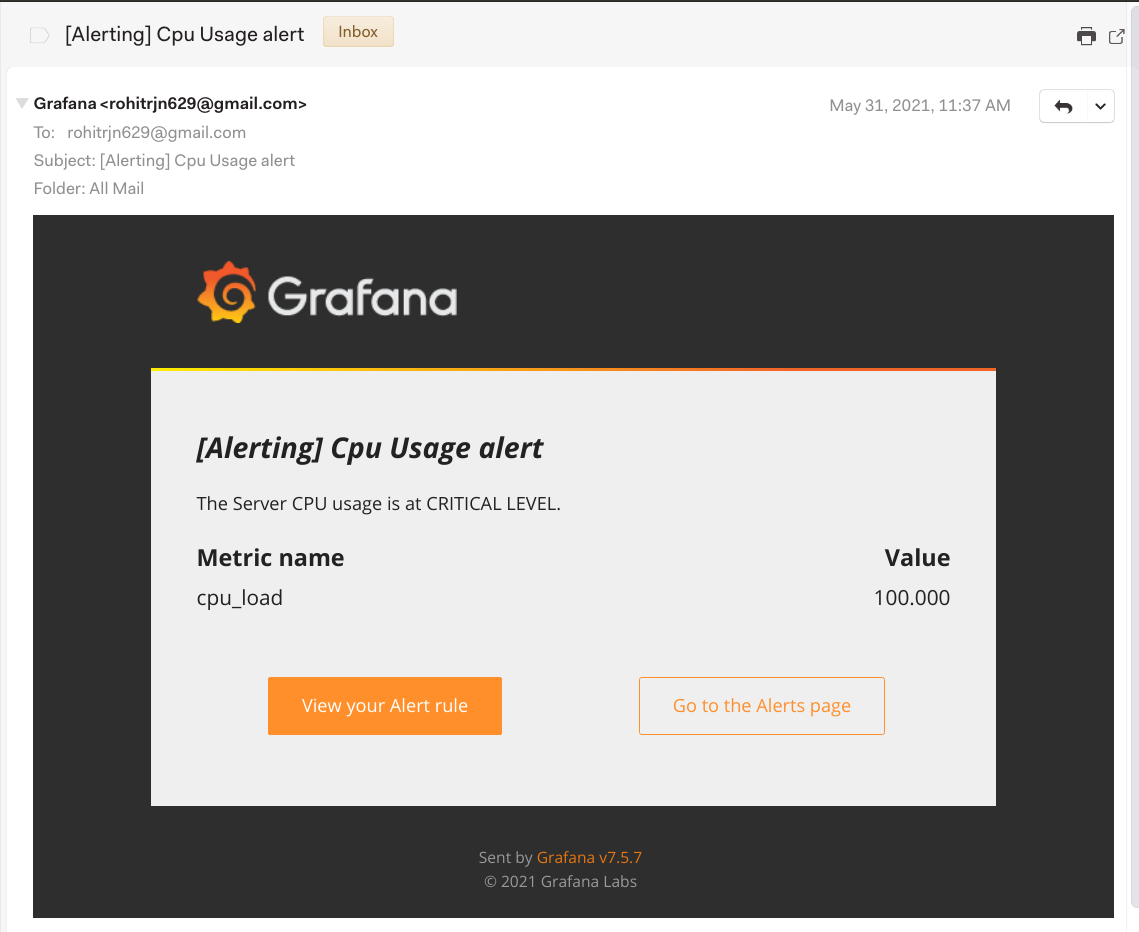
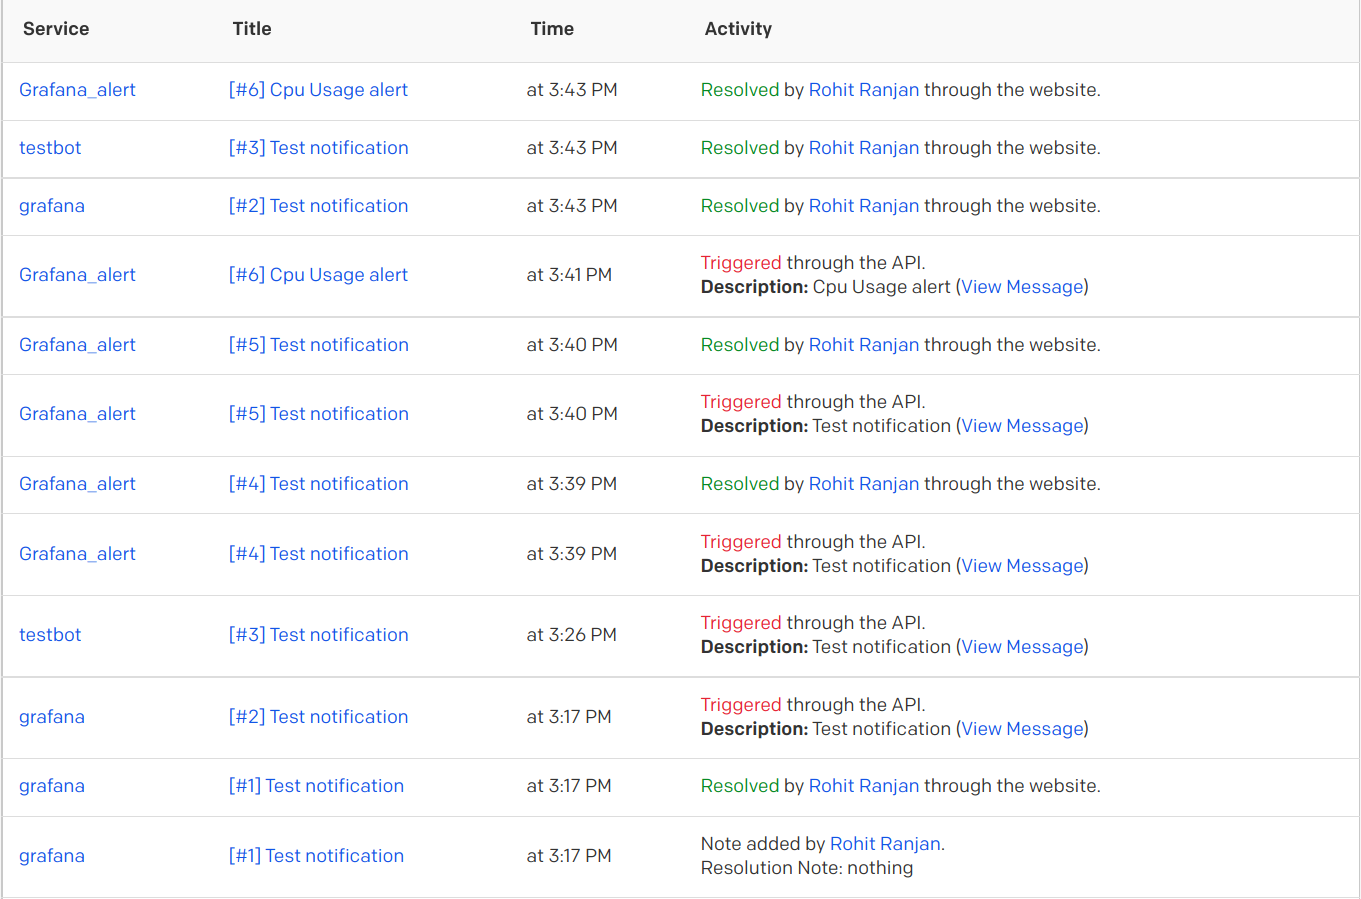
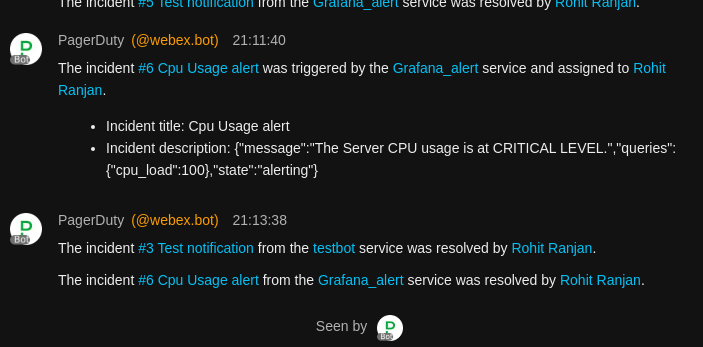
I've used gmail as well as pagerDuty bot to create alerts.
The grafana-server will create alerts on the basis of RAM/CPU usage. If RAM/CPU % usage crosses 80
then it'll send a alert through mail & PagerDuty(which connects to pagerDuty bot to my space).
A snapshot of cpu-alert is shown here:


