A MATALB toolbox for working with micro CT images.
Download the current binary release and open microCT-v1.2.2.mltbx in MATLAB to install the toolbox.
Clone this repository and initialize all submodules with
git submodule update --init
In the toolbox folder open microCT.prj in MATLAB and click package.
Open the generated microCT.mltbx file in matlab to install the toolbox.
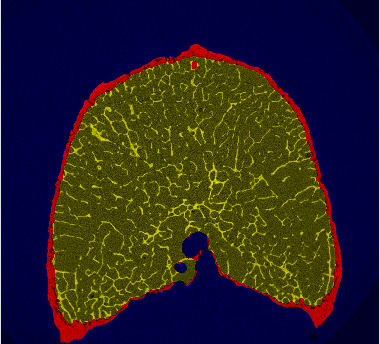
µCT scan volume of a bone, two thresholds
Periosteal and endosteals binary masks
- the periosteal mask includes the complete bone, bounded by the periosteal surface
- the endosteal mask includes only the interior regions of the bone, bounded by the endosteal surface.
The cortex mask can be generated by XORing of the periosteal and the endosteal mask.
[perioMask, endoMask] = microCT.segmentCortex(volume, 500, 400, 10);
c = floor(size(volume) / 2);
microCT.plotSegmentation(volume(:, :, c(3)), perioMask(:, :, c(3)), endoMask(:, :, c(3));The method used to segment the cortical bone is based on "Automatic segmentation of cortical and trabecular compartments based on a dual threshold technique for in vivo micro-CT bone analysis" by Buie et al. (2007). The implementation in this toolbox uses 3D operations on the complete volume, not only 2D operations on a per-slice base. This way the produced masks are of high quality, but on the downside the method is computationally more expensive. Also a smoothing operation is added to the endosteal mask creation process to make the endosteal surface less sensitive to trabecles branching from the cortex.
Beware that dependeing on the size of the input volume, this function may take a lot of time and use a lot of memory. For example segmenting a 3 giga voxel volume takes about 12 hours on a Intel(R) Core(TM) i7-8700K CPU @ 3.70GHz with 64GB of RAM and has a peak memory consumption of about 80GB.
- Periosteal mask
- Endosteal mask
- Signed distance field form cortex center
- Local cortical thickness (Ct.Th.) field
See next section
- Signed distance field to center of cortex
- Cortical thickness field
- (Optional) smoothing factor
- Triangle index list
- Vertex list
- Per-vertex cortical thickness values
% Extract signed distance field
[cDist, CtTh] =  microCT.cortexDistanceField(perioMask, endoMask);
% Convert pixel distnces to mm, assuming isotropic 30µm voxels
CtTh = CtTh * 0.03;
% Extract iso surface of smoothed signed distance field
[F, V, C] = microCT.meshCortex(cDist, CtTh, 10);

% Display results
patch('vertices', V, 'faces', F, 'edgeColor', 'none', 'facecolor', 'interp', 'facelighting', 'phong', 'FaceVertexCData', C);
light;
axis equal offIf optional smoothing is enabled the signed distance field to the cortex center is first smoothed using a 3D gaussian filter. Next iso2mesh is used to extract the iso-surface at zero distance to the cortex center. Since iso2mesh does only support volumes up to 1 giga voxels, the volume may be scaled down to that size. In this case it is important to specify a smoothing to avoid aliasing. The resulting mesh is then scaled up to match the size of the input volume. Cortical thickness values are obtained by cubcic interpolation of the Ct.Th. field at the vertex positions of the iso-surface mesh.
With this method only a very sparse sampling of the input volume can be acquired, giving poor esimates. For a more robost method refer to the next section.
With the above method only sparse Ct.Th. and Ct.BMD. estimates can be acquired. Since version 1.1.0 a dense sampling of the input volume is supported.
- Local cortical thickness field
- Cortex center mesh
- Per-vertex cortical thickness measurements
- Per-vertex cortical thickness corresponding to the average cortical thickness of the volume that encloses the adjacent triangles
- Per-vertex cortical BMD corresponding to the average cortical thickness of the volume that encloses the adjacent triangles
- Densely sample the mesh surface so that each intersecting volume voxel contains at least one sample
- For each sample: sample the volume along a profile orthogonal to the surface and average all valid BMD values to get a per-sample average BMD
- For each vertex: compute the weighted average of all sample values (BMD and thickness) inside adjacent triangles
There is one function microCT.perVertexCtThCtBMD() that can be used to run all step automatically. To perform each step separately, have a look at perVertexCtThCtBMD.m.
% Using the output of the previous examples
[perVertexCtTh, perVertexCtBMD] = microCT.perVertexCtThCtBMD(F, V, C, volume, CtTh);

% Convert voxel scale to mm, assuming 30µm isotropic voxels
perVertexCtTh = perVertexCtTh * 30e-3;

% Display results
subplot(1, 2, 1);
patch('vertices', V, 'faces', F, 'edgeColor', 'none', 'facecolor', 'interp', 'facelighting', 'phong', 'FaceVertexCData', perVertexCtTh);
light;
axis equal off
title('Dense Ct.Th. [mm]')
colorbar
colormap hot

subplot(1, 2, 2);
patch('vertices', V, 'faces', F, 'edgeColor', 'none', 'facecolor', 'interp', 'facelighting', 'phong', 'FaceVertexCData', perVertexCtBMD);
light;
axis equal off
title('Dense Ct.BMD [mg/cc]')
colorbar
colormap hot

