A Kibana visualization plugin that allows arbitrary query results to be processed by a Mustache transform.
Installation for Kibana 6.4.0:
bin/kibana-plugin install https://github.com/PhaedrusTheGreek/transform_vis/releases/download/6.4.0/transform_vis-6.4.0.zip
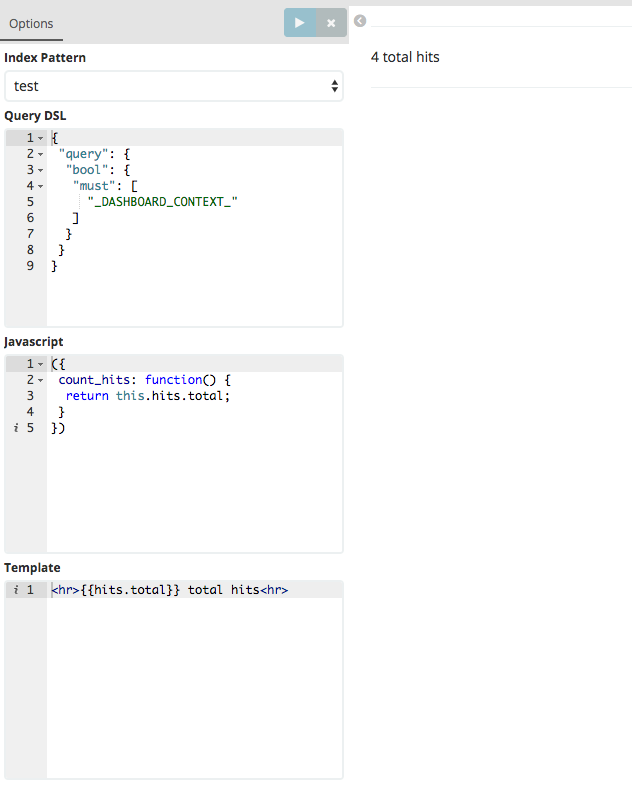
The object passed to the mustache template looks like this:
{
  response: { .. } // The Query Response exactly as returned from Elasticsearch
  context: { .. } // The dashboard context (contains filters, query string, time range)
  meta: { .. } // Your Javascript Object
}
From mustache, you can access these variables directly. From the Javascript Object, you can access
From the Javascript object, they're available via this, e.g., this.response
By default, no unsafe HTML (such as <style> tags) will be allowed, as processed by Angular's $sanitize , but Javascript processing can be achieved by acknowledging the client-side security risk in kibana.yml with transform_vis.allow_unsafe: true. When enabled, a "Javscript" box appears that allows you to create a special object that will be merged with the query's response object under the field name meta.
<script> tags will not be evaluated.
Any Javascript given will be executed by the web browser, however in order to be merged with the query response object for processing by Mustache, you must prepare an Object, enclosed by parentheses like this:
({
 some_var: 42,
 count_hits: function() {
  return this.response.hits.total;
 }
})
Named functions can then be called by mustache, like:
<hr>{{meta.count_hits}} total hits<hr>
Functions called by mustache are executed before the actual render on the page, so no DOM manipulation can be done. As of Version 6.2.2, the before_render and after_render lifecycle hooks will be called automatically. The former can be used for any pre-processing that might be required before rendering, and the latter should be used for anything that expects the HTML to be rendered. e.g.:
Javascript:
({
  after_render: function() {

    var sampleSVG = d3.select("#viz")
        .append("svg")
        .attr("width", 100)
        .attr("height", 100);

    sampleSVG.append("circle")
        .style("stroke", "gray")
        .style("fill", "white")
        .attr("r", 40)
        .attr("cx", 50)
        .attr("cy", 50)
        .on("mouseover", function(){d3.select(this).style("fill", "aliceblue");})
        .on("mouseout", function(){d3.select(this).style("fill", "white");});
  }
})
Template:
<div id="viz"> </div>
Find a more detailed D3 recipe in the examples cookbook
<style> tags can be embedded in the mustache template, but requires transform_vis.allow_unsafe: true in kibana.yml
"_DASHBOARD_CONTEXT_", including the surrounding quotes, will be replaced by a bool query that represents the filter/search state of the dashboard in context.
This example is given to demonstrate how the dashboard context can co-exist with your own query clauses, but you are not restricted to this format.
The following code produces multi-level bool statement:
{
 "query": {
  "bool": {
   "must": [
     "_DASHBOARD_CONTEXT_"
     .. your must clause(s) can go here ..
   ],
   "should": [
     .. your should clause(s) can go here ..
   ]
  }
 }
}
On a default dashboard, it will be executed as:
POST skillsuggest_test/skilltype_test
{
   "query": {
      "bool": {
         "must": [
            {
               "bool": {
                  "must": [
                     {
                        "query_string": {
                           "query": "*"
                        }
                     },
                     {
                        "range": {
                           "postDate": {
                              "gte": "now-5y",
                              "lte": "now"
                           }
                        }
                     }
                  ],
                  "must_not": []
               }
            }
         ]
      }
   }
}
Here's something that compares aggregation results with other results content.
Query:
{
 "query": {
  "bool": {
   "must": [
     "_DASHBOARD_CONTEXT_"
   ]
  }
 },
 "size": 0,
 "aggs" : {
    "parse_failures" : {
       "filter" : { "term": { "tags.keyword": "_fail" } }
    }
 }
}
Javascript:
({
    percent_fail: function() {
        return Math.round((this.response.aggregations.parse_failures.doc_count / this.response.hits.total) * 100);
    }
})
Mustache:
<hr>
 <b>Percent Failures: {{meta.percent_fail}}%</b><BR>
 Total Hits: {{hits.total}}  <BR>
 Failures: {{aggregations.parse_failures.doc_count}}
<hr>
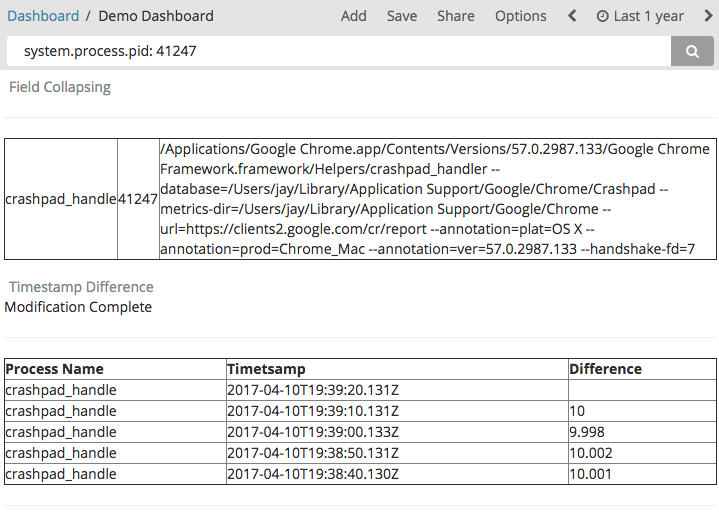
Elasticsearch 5.3 Introduces Field Collapsing. Here's an example of displaying Chrome processes from Metricbeat logs. We might have a bunch of logs for the same PID, but with Field collapsing we can easily make sure we only see the most recent (see sort) log from each PID.
Query:
{
   "size": 5,
   "query": {
      "bool": {
         "must": [
            "_DASHBOARD_CONTEXT_",
            {
               "regexp": {
                  "system.process.cmdline": ".*Chrome.*"
               }
            }
         ]
      }
   },
   "collapse": {
      "field": "system.process.pid"
   },
   "sort": {
      "@timestamp": {
         "order": "desc"
      }
   }
}
Mustache:
<hr>
<table width=100% border=1>
{{#response.hits.hits}}
<tr>
 <td> {{_source.system.process.name}} </td>
 <td> {{_source.system.process.pid}} </td>
 <td> {{_source.system.process.cmdline}} </td>
</tr>
{{/response.hits.hits}}
</table>
<hr>
Awesomely, if you call a Javascript function at the beginning of your Mustache template, you can actually modify the query results object. Here is an example that calculates the difference in time between each event.
Query:
{
   "size": 5,
   "query": {
      "bool": {
         "must": [
            "_DASHBOARD_CONTEXT_"
         ]
      }
   },

   "sort": {
      "@timestamp": {
         "order": "desc"
      }
   }
}
Javascript:
({
 modify: function() {
  var last_timestamp;
  this.response.hits.hits.forEach(function(element) {
    var this_timestamp = element._source['@timestamp'];
    console.log(last_timestamp);
    if (last_timestamp) {
         element._diff_seconds = (new Date(last_timestamp).getTime() - new Date(this_timestamp).getTime()) / 1000
    }
    last_timestamp = this_timestamp;

  });
  return "Modification Complete";
 }
})
Mustache:
{{meta.modify}}

<hr>
<table width=100% border=1>
<tr>
 <th> Process Name </th>
 <th> Timetsamp </th>
 <th> Difference </th>
</tr>
{{#response.hits.hits}}
<tr>
 <td> {{_source.system.process.name}} </td>
 <td> {{_source.@timestamp}} </td>
 <td> {{_diff_seconds}} </td>
</tr>
{{/response.hits.hits}}
</table>
<hr>
You can dump the response object to a <pre> tag in your visualization output while testing, for convenience.
({
 count_hits: function() {
  return this.response.hits.hits.length;
 },
 debug: function() {
  return JSON.stringify(this, null, ' ');
 }
})
Mustache:
<hr>
  {{response.hits.total}} total hits<BR>
  {{meta.count_hits}} returned hits<BR>
<hr>

<pre>
{{meta.debug}}
</pre>