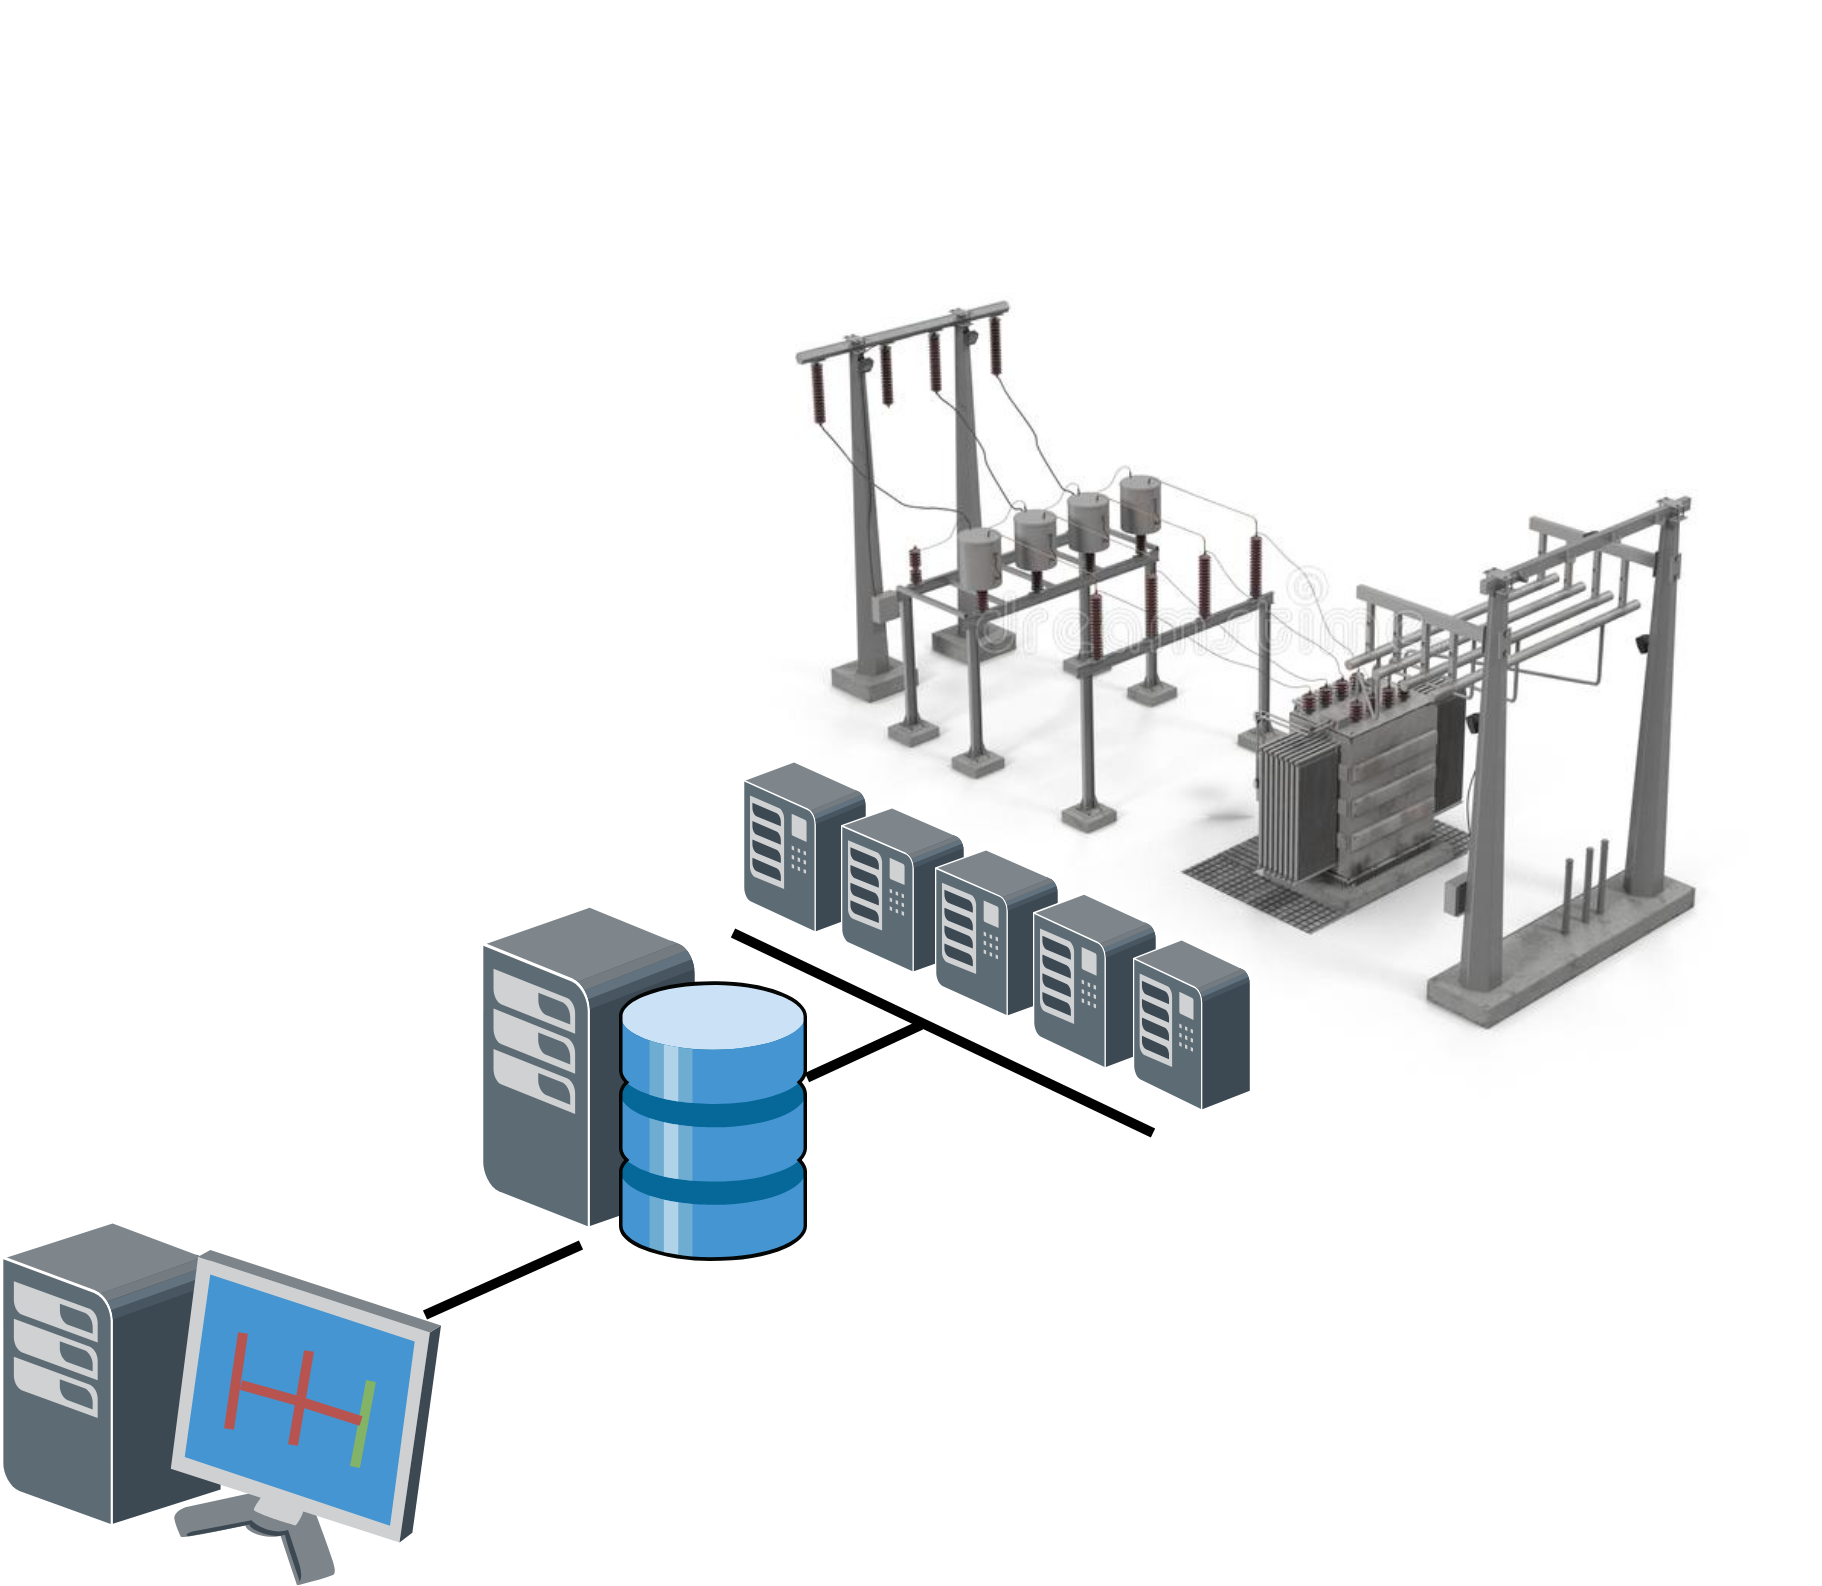
This is an open source project for a basic ems/dms scada system. It contains a HMI(human-machine-interface) with vector graphics tailored towards power-scada, and supports an IEC60870-5-104 based IFS (the connection between the field devices and the central scada).
The following version of docker and docker-compose were used and tested:
- Docker version 20.10.12, build 20.10.12-0ubuntu4
- docker-compose version 1.29.2, build unknown
A key needs to be generated before mongodb can start in replication mode. use generate_key.sh for this, and ensure ownership and permissions are set. Else the mongodb replication set will not initialise. Replication is in turn needed for journaling so changes can be detected by the IFS. Secondly, generate_new_env_secrets.sh should be run to generate fresh secrets for the databases.
After that, the containers can be build and spun up using portainer or docker-compose.
$ git clone https://github.com/robidev/open_scada_dms.git
$ cd open_scada_dms/mongodb
$ sudo ./generate_key.sh
$ cd ..
$ sudo ./generate_new_env_secrets.sh # optional step for generating unique database secrets in .env from env.template and update grafana datasource config
$ sudo docker-compose build
$ sudo docker-compose up -d redis influxdb mongodb portainer # first start the databases, and container management console and let them initialise themselves
$ sleep 60 # wait about 60 seconds for mongodb to have been set up
$ sudo docker-compose up -d mongoClientTemp # create the mongodb scada user when the database is done initialising
$ sleep 5 # ensure the mongodb user has been generated
$ sudo docker-compose up # start everything else; scada_client, grafana, static_dataprovider, solver, ifs, mongodb admin panel, redis admin panel
browse to http://127.0.0.1:5000
It might be that due to initialisation of the databases, some containers fail due to connection timeouts. Have a look in portainer (username: admin, password: administrator), and restart the stopped containers. Additionally, you can attempt another $ sudo docker-compose up
The system will start with an example configuration, and a simulated gateway.
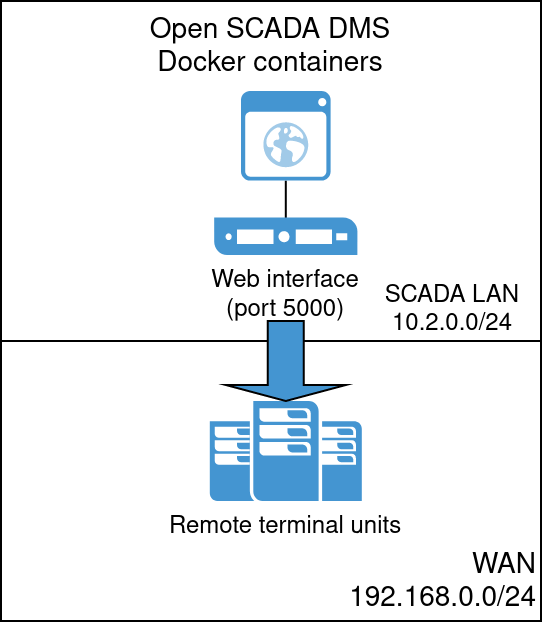
If you configure an additional dataprovider in the dataproviders tab by pressing 'add dataprovider', such as an RTU, and connect it to your system, it can connect to it.
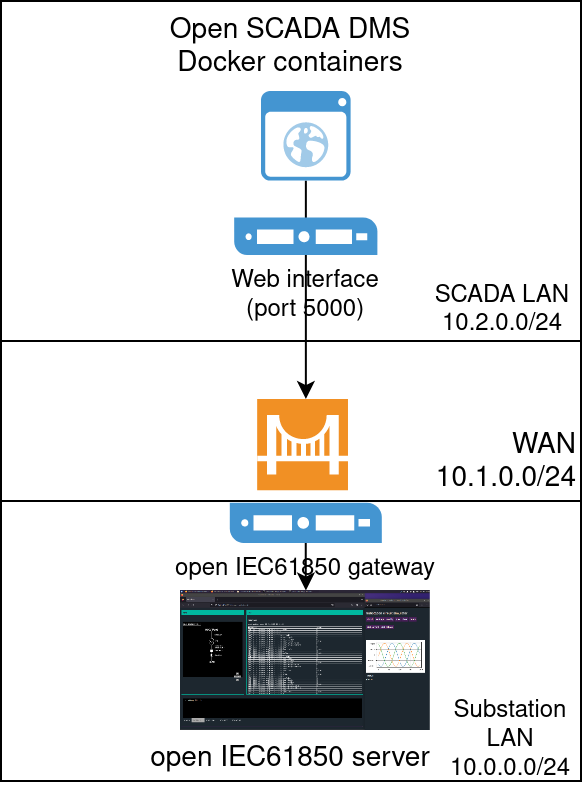
If you wish a fully simulated environment, from physical process, to IED, to RTU and all the way up to DMS, you should do the following;
$ git clone https://github.com/robidev/iec61850_open_server.git
$ git clone https://github.com/robidev/iec61850_open_client.git
$ git clone https://github.com/robidev/iec61850_open_gateway.git
$ git clone https://github.com/robidev/open_scada_dms.git
then you define iec61850_open_gateway/gateway.yml
version: "3.3"
services:
  gateway:
    build:
      context: .
      dockerfile: Dockerfile.libiec61850_gateway
    hostname: gateway
    networks:
      subnetwork1:
        ipv4_address: 10.0.0.250
      scada_wannetwork:
        ipv4_address: 10.1.0.10
    privileged: true
    depends_on:
      - "ied1_xcbr"
      - "ied2_ptoc"
      - "ied3_smv"
      - "ied4_smv"

# networks should not be defined twice, or you get an error regarding missing subnet
networks:
  scada_wannetwork:
    driver: bridge
    external: true
Build the substation , client and gateway, start all containers regarding the substation from the iec61850_open_server directory and finally, we start the open_scada_dms from the open_scada_dms directory:
$ cd iec61850_open_server
$ sudo docker-compose -f substation.yml -f substation.simulator.yml -f ../iec61850_open_gateway/gateway.yml build
$ sudo docker-compose -f substation.yml -f substation.simulator.yml -f ../iec61850_open_gateway/gateway.yml up
cd ../open_scada_dms
$ sudo docker-compose up mongodb influxdb redis grafana static_dataprovider ifs solver portainer scada_client
(so omit the test_gateway, as you will be using the simulated one instead, and they sit on the same WAN IP; 10.1.0.10)
When you start the simulation on the iec61850_open_client via the web-interface, you should see values start to update on the open_scada_dms web interface.
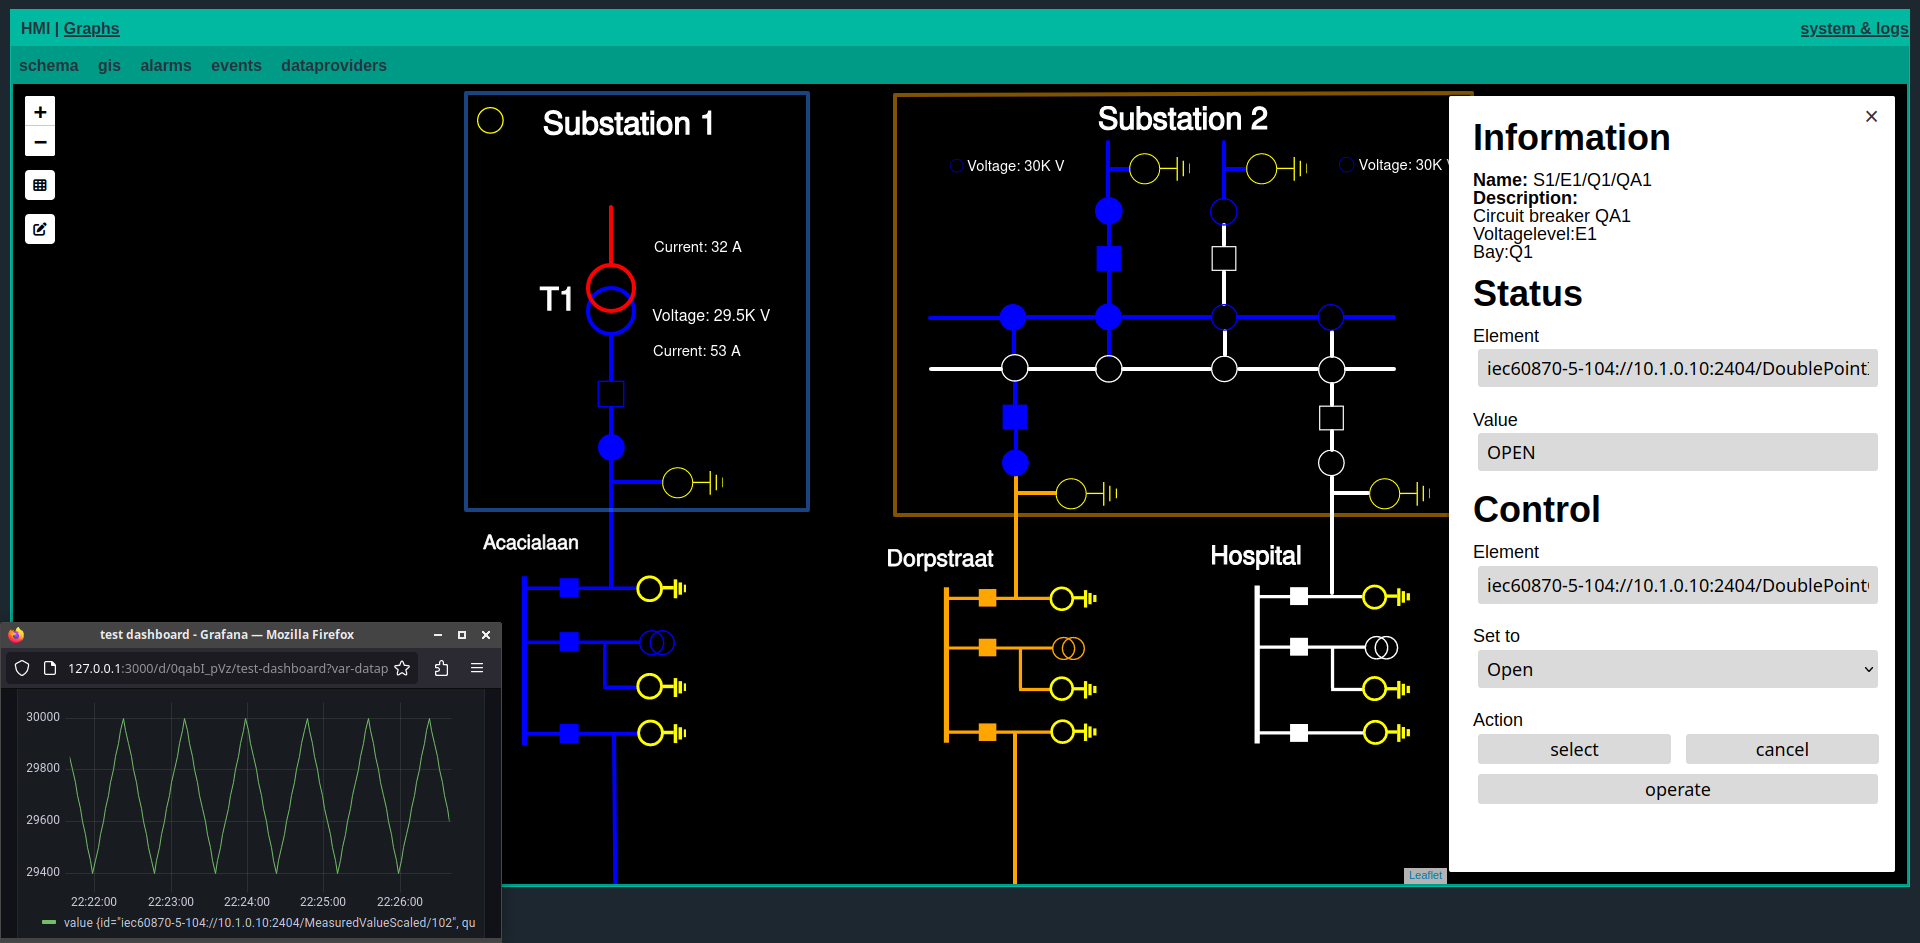
Schema shows a schematic view of a power grid, with scroll and zoom capability. gis is data overlayed on a geographic map. Data is live updated, and the view is animated. Clicking elements will reveal a sidepanel with name and description information, and more data if available.
if you click an operateable control in the map such as a square or circle, a side-panel will be shown with the control. The dialog will allow for actions to be executed such as select, cancel and operate. Additionally, if you click a datapoint reference, you get a window with a graph of historic values. Hovering over a datapoint-field will reveal the whole item, if the element is too small.
If you click a datapoint in the sidepanel, a new window will open with the values of that datapoint from the last seven days plottet in a graph. Time and display can be modified in the window. For further understanding of grafana and its power, it is advised to follow some courses;
Alarms are shown in the alarms tab. alarm logic can be added, edited and removed via the edit button. Alarms can be open or closed, and acknowledged and unacknowledged. only closed alarms are hidden from the view, but can be seen in the event log. Events are static, and can be viewed and sorted. more advanced analysis can be done in grafana.
configurable alarms include
- Analog limit violation alarms
- Point status change alarms (e.g. trip alarms)
- communication alarms, loss of communication to dataprovider or Front End(IFS)
- Any event message such as control actions
All datapoints need a dataprovider. by default, there is a static dataprovider front-end that just allows a datapoint to be defined. after writing a value to a datapoint, it exists, and can be updated.
The solver is another dataprovider front-end, but one that is not stored in the historical database, as it is only a visual aid.
The IFS is a dataprovider front-end for actual data retrieved from external devices. currently only iec60870-5-104 is supported, but implementing support for modbus, iec61850, tase.2, dnp3 or iec60870-5-101 should be easy enough. After a new dataporvider front end is added, the dataproviders and datapoints it retrieves can be used immediatly by the scada.
Open edit mode with pen button on the left side on the map. Clicking on an item will open the side pane with items to modify. A grid can be displayed as a helper to align items to. You can add and svg from a template or from the template database db by using the edit buttons. Svg items have a size and position, and can be animated. SVG objects can be imported or chosen from a library. basic shapes can be drawn and styled based on datapoint values. The editor bars allow objects to be added, edited and removed. Clicking an object allows to edit data regarding the coupling to datapoints.
Some premade svg have been provided that include a datapoint and animation for open, close and loss of power(normal/fail). Each svg uses id's for defining the element the datapoint should connect to. The class provides information how the animation should be called.
Polygon, polyline and squares/circles can also be added with the corresponding buttons. These items can be styled in the edit menu, or styled dynamically via datapoints.
Overrides can be used to statically override some properties. This can be used for example to modify text, or change style/color of an svg. Objects can have values overwritten during initialisation, using javascript entities. e.g. to overwrite svg tekst, use an array of dicts:
"overrides" : [
	{
		"element_id": "svg_text",
		"property":"textContent",
		"value": "substation 1"
	}
]
check the svg file for the ekement_id to overwrite.
Svg objects allow datapoints to be attached to control animations. Based on the defined class in the svg element, certain animation id's are assumed. e.g. and XCBR and XSWI class element have an 'open' and 'close' animation. Datapoints are mapped to svg-identifiers as such: [datapoint]:[svg-id] e.g.:
"datapoints": [
	{
		"static://local/DoublePointInformation/300": "datapoint_status"
	},
	{
		"static://local/DoublePointCommand/6000": "datapoint_control"
	},
	{
		"static://local/MeasuredValueScaled/102": "datapoint_voltage"
	}
]
The datapoint_* element is defined as the (parent) element_id of the element that has the animation. The exact element id is found in the svg.
All schema network elements in the example have a 'normal' and 'fail' mode animation. normal is the normal color. fail turns the item white.
The operate dialog is triggered by making an svg element clickable, and calling the open_control(event, datapoint) javascript function via onclick. The event is passed from the svg element. The datapoint should contain the element to operate on. The id of the svg element that is clicked is used as the associated status element. by convention it is easy to consider all interactive switches to contain 2 datapoint, e.g. swi_status and swi_oper. the oper element can be the same datapoint as the status. but with some protocols sich as iec60870-5-104 and modbus, it is common to write to a different point, than what reads the status.
By defining a type, we can hint to the scada-client what type of datapoint it is, so it can display the data more user friendly. current types are;
bool, doublepos and int. Any type has to be appended with an underscore and an operation model. These models are direct and SBO. Direct operatrion will only display an operate button, while SBO(select-before-operate) will display a select, cancel and operate button.
Datapoints can also have a nameplate and description element. These elements overwrite the general nameplate and description if defined in the svg properties. This can help to provide context for more complex svg graphics with multiple switches
Geojson objects can have logic attached to modify properties based on datapoints. example:
  "datapoints": [
    {
      "static://local/DoublePointInformation/300": [
        "color",
        ">",
        "1",
        "#00ffff"
      ]
    },
    {
      "static://local/DoublePointInformation/300": [
        "color",
        "<",
        "2",
        "#0000ff"
      ]
    }
  ]
Datapoints contain lists of dicts regarding the modifications that should occur. the key is the datapoint reference to use as input. Then the following list is used:
template_item = {
	"datapoint":
		[
			'<element-id>',
			'<comparisson>','
			'<value>',
			'<value to assing to element-id>'
		]
	}
e.g. {"1":["color","gt","10","#00ff00"]}; -> if(value > 10){color = '#00ff00';}
Each object can be viewed or hidden at a certain zoom level. use z_min and z_max to define the zoom level the object should be visible/hidden. the zoom level can be viewed in the url bar as part of the coordinate hash.
editing is done via the edit rules button in the alarms window. there a json config is shown for all alarms that can be edited and updated. datapoints can be datapoints on the map, or a combination of element+"."+message from the event window. Then a compare operation can be chosen such as <,>,==,!= where it will be compared to value_1. for >< 2 values have to be provided; value_1 and value_2. When a condition is met, action is executed. this can be set_alarm, reset_alarm, or event. An action contains an id, so by using this id, a reset action can be done as well.
An element field is a reference for display in the alarm window/event.
retrigger will indicate if an open alarm should be overwritten on new events with the same datapoint/alarm_id
  "iec60870-5-104://127.0.0.1:2404/MeasuredValueScaled/101":{
    alert_id = 1, # alert id within this datapoint
    logic = ">", # logic to apply to value
    value_1 = 89,value_2 = 0, # test values to check logic and value with
    actions = {"set_alarm":"OverVoltage"}, # actions to perform on match
    retrigger = False, # retrigger on every match, or only if new alarm (allows for polling)
    element = "ref", # text elements to be logged in alarm/event window)
    message = "message to display",
    details = "links to schema and gis",
    severity = 3
}Dataproviders can be added, modified or removed. modifying the IP will always create a new dataprovider. the IFS and type defines the dataprovider front-end to be used
The open_scada_dms attempts to approach some of the main functions of a real SCADA DMS system. However, it should probably not be used in production ,as no guarantee is provided about its reliability. It is purely educational. That being said, the system should be able to scale, and supports a fully scalable, redundant setup.
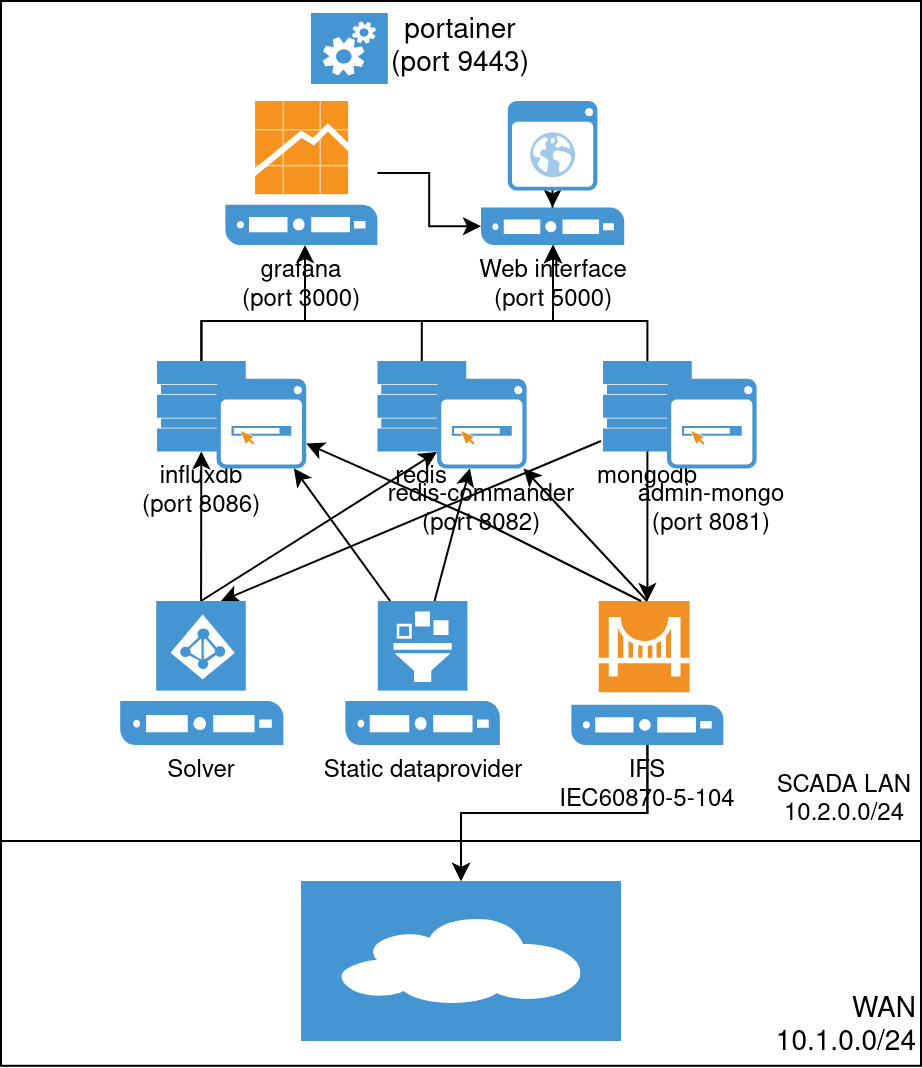
The main components and its ports are listed as follows;
The following containers are included:
| container | purpose | port | username | password |
|---|---|---|---|---|
| portainer | for docker administration | https/9443 | admin | Administrator |
| scada_client | main application | http/5000 | - | - |
| grafana | for historical data analysis | https/3000 | admin | admin |
| mongodb | mongodb database | - | [.env] | [.env] |
| admin-mongo | for mongodb administation | http/8081 | admin | admin |
| redis | redis real-time database | - | - | [.env] |
| redis-commander | for redis administration | http/8082 | admin | admin |
| influxdb | for influxdb administration | https/8086 | admin | administrator |
| ifs | for connection to (external) RTUs | - | - | - |
| static_dataprovider | for static datapoints | - | - | - |
| solver | for solving power flow in the network | - | - | - |
Portainer is the container orchestration
The frontend is scada_client, a python/flask/socketio based web interface using leaflet and tabulator for the gui. Graphs are provided by Grafana.
The backend is powered by mongodb for persistence, influxdb for time-series and historic data, and redis for the real-time database.
The project is a collection of containers, and tries to mainly rely on actively developed projects that are fairly self contained.
Value initialisation is done on startup, and redis, influxdb and mongodb are persistent regarding data storage. .env stores all keys, credentials and other project specific environment variables
Grafana is used for displaying graphs of datapoints, and analyzing historical data and trends from the influxdb time-series database.
This is a service to connect to RTU's based on a table in mongodb, and retrieve values, and perform operations on them.
IFS can be run on localhost or in a container. no argument means localhost, an argument(such as "remote") will assume it is run from a container
Please note it uses the (awesome!) libiec60870 library from MZ-automation, that contains the GPLv3 license.
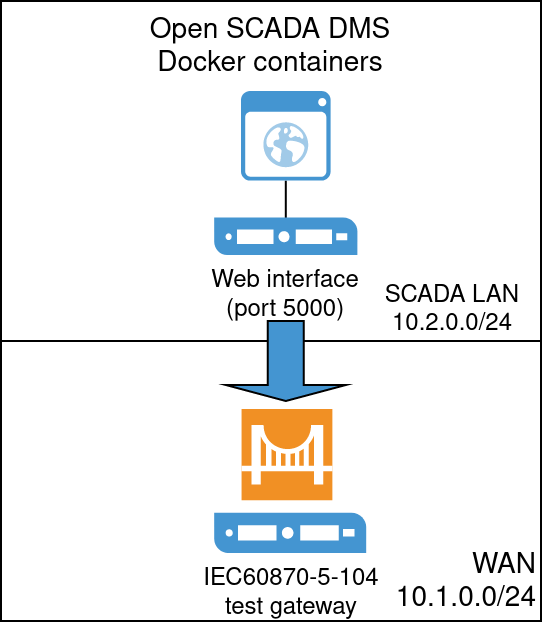
Test gateway can be used to simulate a gateway/RTU, and will open port 2404 to allow an IEC60870-5-104 connection from the IFS
Please note it uses the (awesome!) libiec60870 library from MZ-automation, that contains the GPLv3 license.
Does not need a schema. it needs a password: (defined in .env)
username=(defined in .env), password=(defined in .env), database=scada has multiple schemas:
  db.createCollection("rtu_list");					  // list of rtu's for IFS
  db.createCollection("alarm_table");		   // stored alarm data
  db.createCollection("alarm_logic");		    // logic for triggering alarms
  db.createCollection("data_timeseries");   // legacy, stored values
  db.createCollection("svg_templates");	  // svg templates to be used for schema and gis
  db.createCollection("schema_objects");   // svg objects for schematic
  db.createCollection("schema_geojson");  // geo objects for schematic
  db.createCollection("gis_objects");			 // geo and svg objects for gis map
It seems mongodb needs the 'mongodb' DNS entry to resolve to the mongodb server-ip, and app.py needs to adress the dns for replication to work. This will just work when run in docker. But if you want to run the client on the host machine, add mongodb 127.0.0.1 to /etc/hosts.
mongoClientTemp is for adding the user to the database, based on the .env defined secrets. it should be run once before connecting with the webinterface/ifs/solver
Token: (defined in .env)
Has 2 buckets:
- bucket_1 - for timeseries data from dataproviders
- bucket_2 - for event data
The solver is used to modify a style(i.e color) of an element, based on the power-flow. By adding network information to the elements in the schema, it will resolve the unknown elements based on simple flow logic and the network topology. E.g. if a known voltage is on a wire, and a switch is connected, when the switch is closed, the other connected wire is set to the same voltage. Based on that model, each connection in the model provides a datapoint, that can be connected to a style of an element. Couplings (such as Transformers) are also seen as connections. Joined wires are seen as one large wire.
You add network information by adding a v_node_list:[] as a property. example:
  "v_node_list": [
    {
      "type": "ext/link",
      "uri": "<datapoint>"
    },
    {
      "type": "coupling",
      "link1": "<datapoint>",
      "link2": "<datapoint>"
    },
    {
      "type": "switch",
      "link1": "<datapoint>",
      "link2": "<datapoint>",
      "input": "<datapoint>"
    }
  ]
Static values can be created for svg by defining datapoints, and operating on them to set a value. it will be stored in the historic db, and the latest value is retrieved when needed for display. This is done by the static_dataprovider. The URIstatic:// is used for static values. When written to via an operate command, a value is created if it did not yet exist and stored in influxdb and redis where it can be read back from.
