demo at heroku (20 sec wake up time)
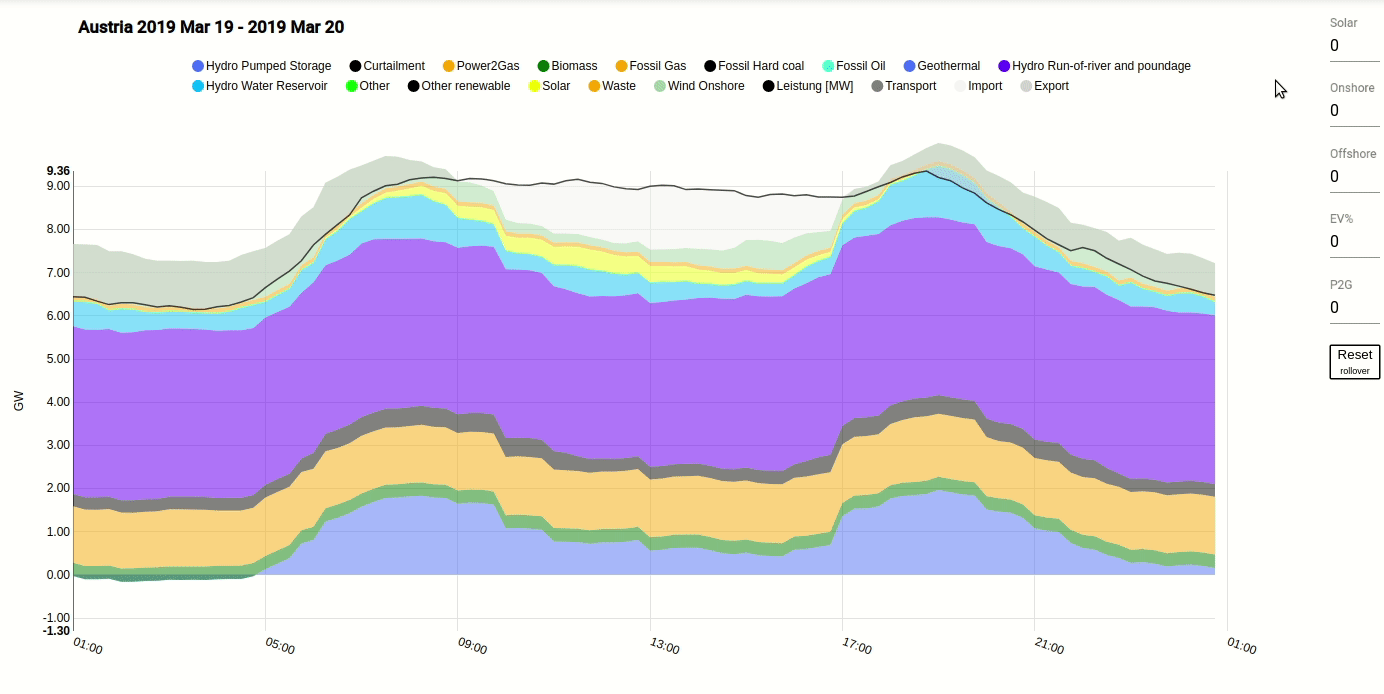
This tool visualizes historic electricity production data provided by ENTSO-E.
Inspired by Fraunhofer ISE(https://www.energy-charts.de/)
git clone https://github.com/robotnic/power-europe-angular.git
cd power-europe-angular
npm install
npm test
Based on the ENTSO-E transparancy data, the user can simulate a past with more renewables.
The user can select a day in the past and simulate the replacement of fossils by renewables.
| peek power | ||
|---|---|---|
| 1 GWp Solar | ~10 km² | 3.000.000 panels |
| 1 GWp Wind | ~200 * 5 MW Wind Turbine |
This tool focuses on responsive illustration and easy usage.
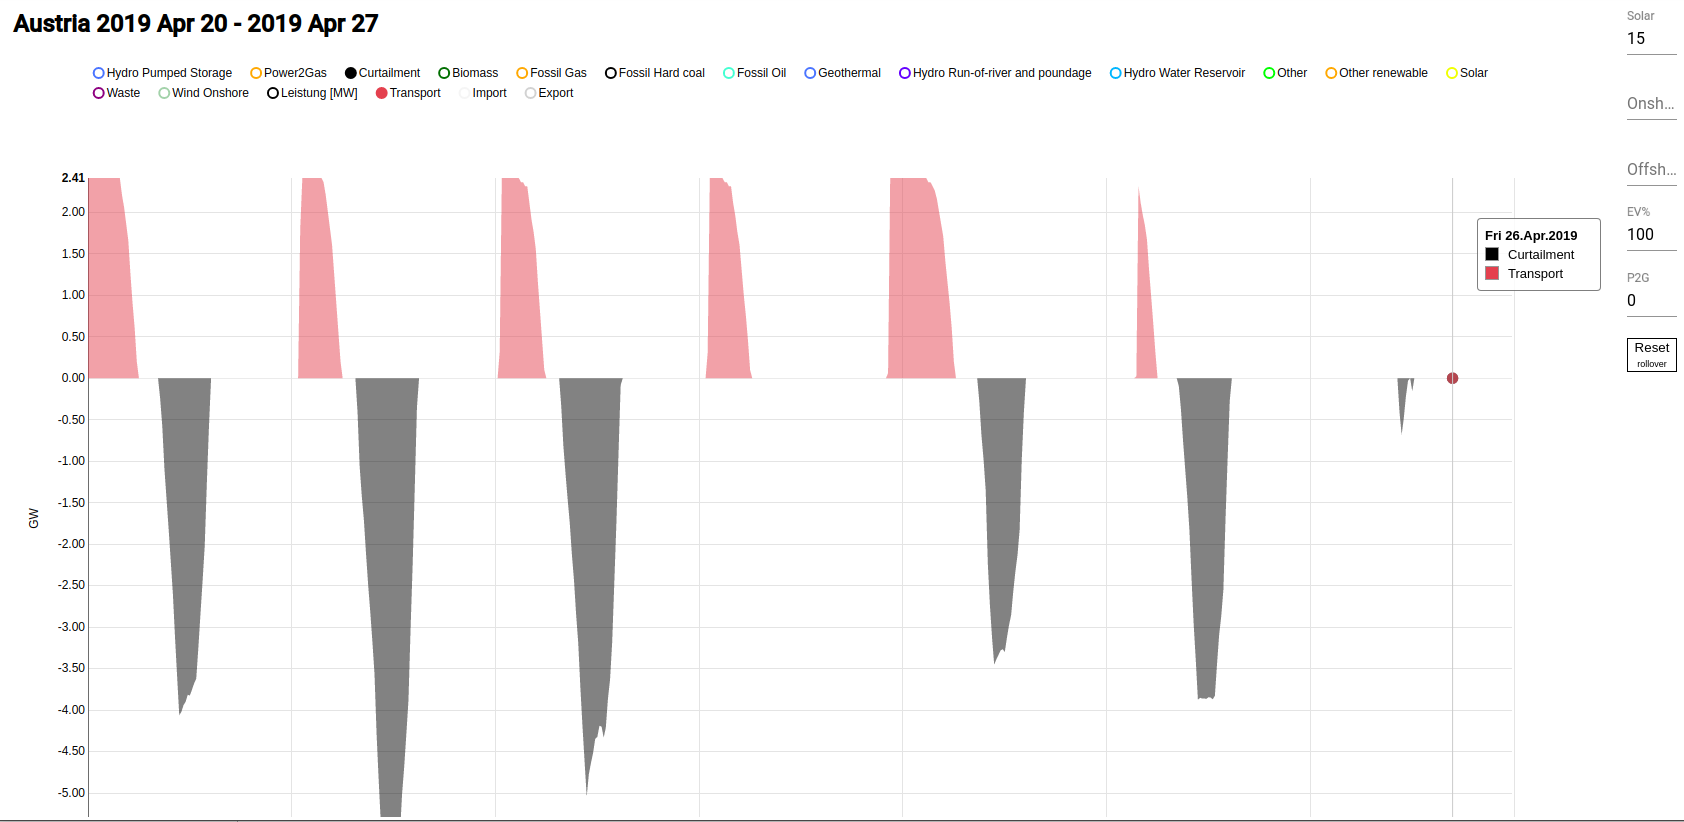
Electricity is only a part of the energy we need. In this tool the effect of electrified transport is shown.

Replacing fossils by electricity, reduces the energy used by the customers. Please have in mind, that that's not equivalent to primary energy.
In the simulation we show the load of charging vehicles as a constant value. We don't know when the E-Cars will charge. But our simulations shows that shifting charging time by some hours, could have a big impact.
The red area shows the additional energy needed by electric vehicles that is not coverd by renewables. The black areas are curtailed energy.
Possible conclusio:
If there is lots of PV in the system, it would be benefitial for the grid, to charge commuter vehicles during worktime.
 To select a single layer, try double-click.
In this diagram PV and Power2Gas are dominant. Power2Gas is shown here before conversion losses.

How much space is needed for PV. Where do we put the installations.

The price of PV is dropping very fast. Large scale installations will pop up in our landscape.
PV needs space. If done well, solar parks can be an eco habitates for lots of species. PV needs less space than biofuils.
Hier some simplified formulas to give you an idea, how it works.
We know the installed Peek Power (Pp) of a specific year. We are able to calculate the effect of more Renewables.
P(new) = P(past) * (Pp(past) + added) / Pp(past);
The power harvested from renewable, is subtracted from fossil energy.
P(coal new) = P(coal past) - P(new) + P(past);
If there are no fossiles needed anymore, the hydro power stations will reduce electricity production.
In this step we release Water from hydro storages.