This lab aims to explore the detection and visualization capabilities of Elastic Stack 8 (XDR) by conducting malicious tests on a Windows 10 machine. Using VirtualBox, a DHCP Server was set up to provide IP addresses for an internal network with two virtual machines: an Ubuntu Server (Elastic Host) and a Windows 10 (Victim). Both virtual machines have dual network adapters, one linked to a NAT with internet access and the other to the internal network. Elastic Stack 8 was installed on the Ubuntu Server VM to detect malicious activity on the Windows 10 VM. Data was gathered from the victim's machine using the Elastic Agent.
The procedure to build this lab can be found here. It was adapted from Reda BELHAJ.
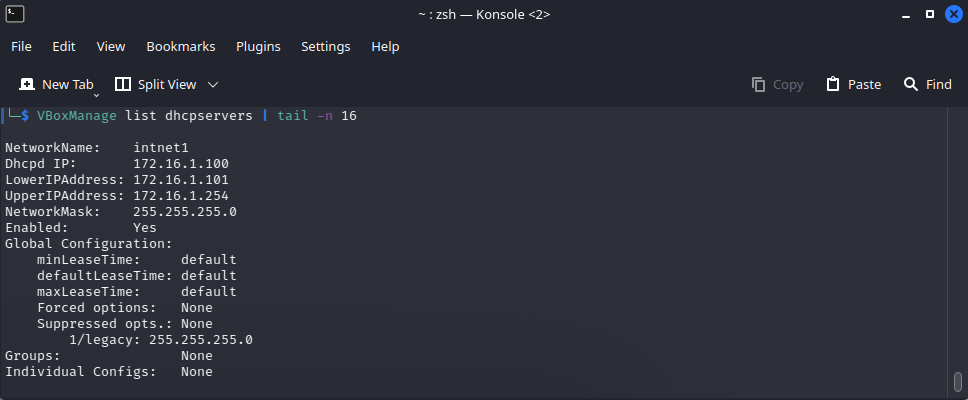
The image below displays the VirtualBox Internal Network named intnet1. In this type of virtual network, the virtual machines can only communicate with each other.
Below is an image showing the IP addresses of the Ubuntu Server VM (left) and the Windows 10 VM (right).

This section provides an overview of Elastic Stack 8, detailing the created policies and the integrations utilized in each policy. Additionally, it discusses the Windows Security setup employed in this lab.
At the core of the Elastic Stack 8 comprises Elasticsearch, the robust data engine, and Kibana, the intuitive user interface. Additionally, Elastic Agent and Integrations are employed to ship data from endpoints.
- Elasticsearch is the distributed search and analytics engine at the heart of the Elastic Stack. Elasticsearch is where the indexing, search, and analysis happen.
- Kibana enables the user interface to navigate the Elastic Stack. With Kibana you can: Search, observe, and protect your data; Analyze your data; Manage, monitor, and secure the Elastic Stack.
- Elastic Agent is a unified way to add monitoring for logs, metrics, and other types of data to a host. It can also protect hosts from security threats, query data from operating systems, forward data from remote services or hardware, and more.
- Integrations are part of the agent's policy to collect data sources such as logs and metrics, to provide security protections, and more. Agent's policy can be updated to add or remove integrations. Elastic Integrations are powered by Elastic Agent.
Fleet provides a web-based UI in Kibana for centrally managing Elastic Agents and their policies. Fleet serves as the communication channel back to the Elastic Agents. Agents check in for the latest updates regularly. When an agent policy is changed, all the agents receive the update during their next check-in. To upgrade the Elastic Agent binaries or integrations, the upgrades can be initiated in Fleet, and the Elastic Agents running on the hosts will upgrade automatically.
All communication between the Fleet UI and Fleet Server happens through Elasticsearch. Fleet writes policies, actions, and any changes to the fleet-* indices in Elasticsearch. Each Fleet Server monitors the indices, picks up changes, and ships them to the Elastic Agents. To communicate to the Fleet about the status of the Elastic Agents and the policy rollout, the Fleet Servers write updates to the fleet-* indices.
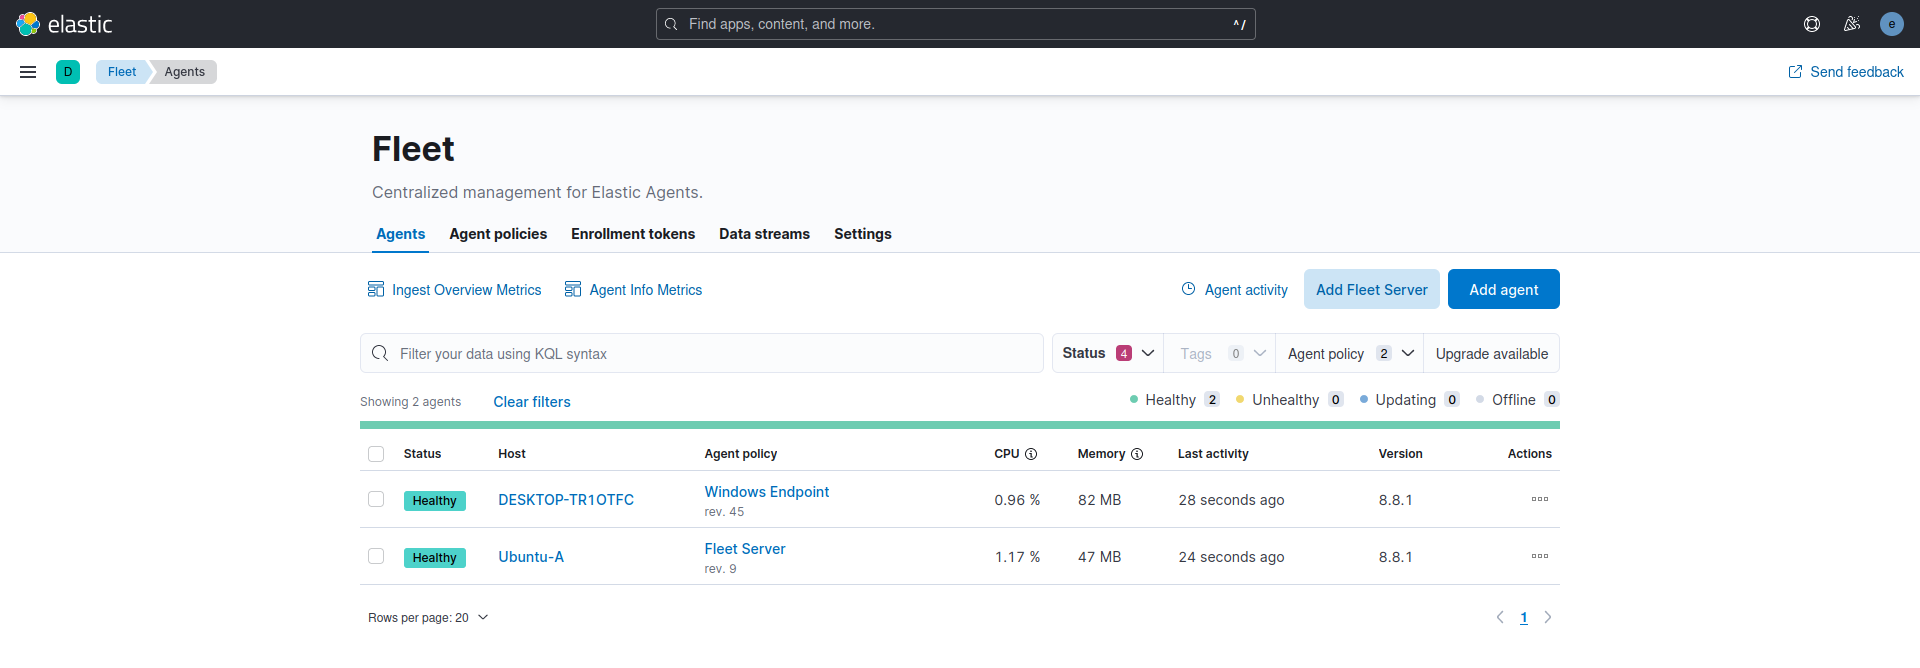
The Fleet Server was installed on the Ubuntu Server (Elastic Host), and its policy incorporates the Fleet Server integration. The System integration was included automatically with the Fleet Server integration but was removed from the Fleet Server policy. The System integration is utilized for shipping log and metric files to the Elastic Host. It can be retained if one desires to collect logs and metrics for monitoring the host operating as the Fleet Server.

The Fleet Server is what connects Elastic Agents to Fleet. Here are some key characteristics:
- It can support an extensive infrastructure and handle numerous Elastic Agent connections.
- It is available for both Elastic Cloud and self-managed clusters.
- The Fleet Server is launched as a separate process within an Elastic Agent on a server and communicates with the deployed Elastic Agents.
- Its responsibilities include updating agent policies, gathering status information, and coordinating actions across Elastic Agents.

The Windows Endpoint Policy comprises the Elastic Defend, System, and Windows integrations.
- Elastic Defend will be used as an anti-virus.
- The system will collect the logs and metrics.
- Windows will collect the event viewer logs.

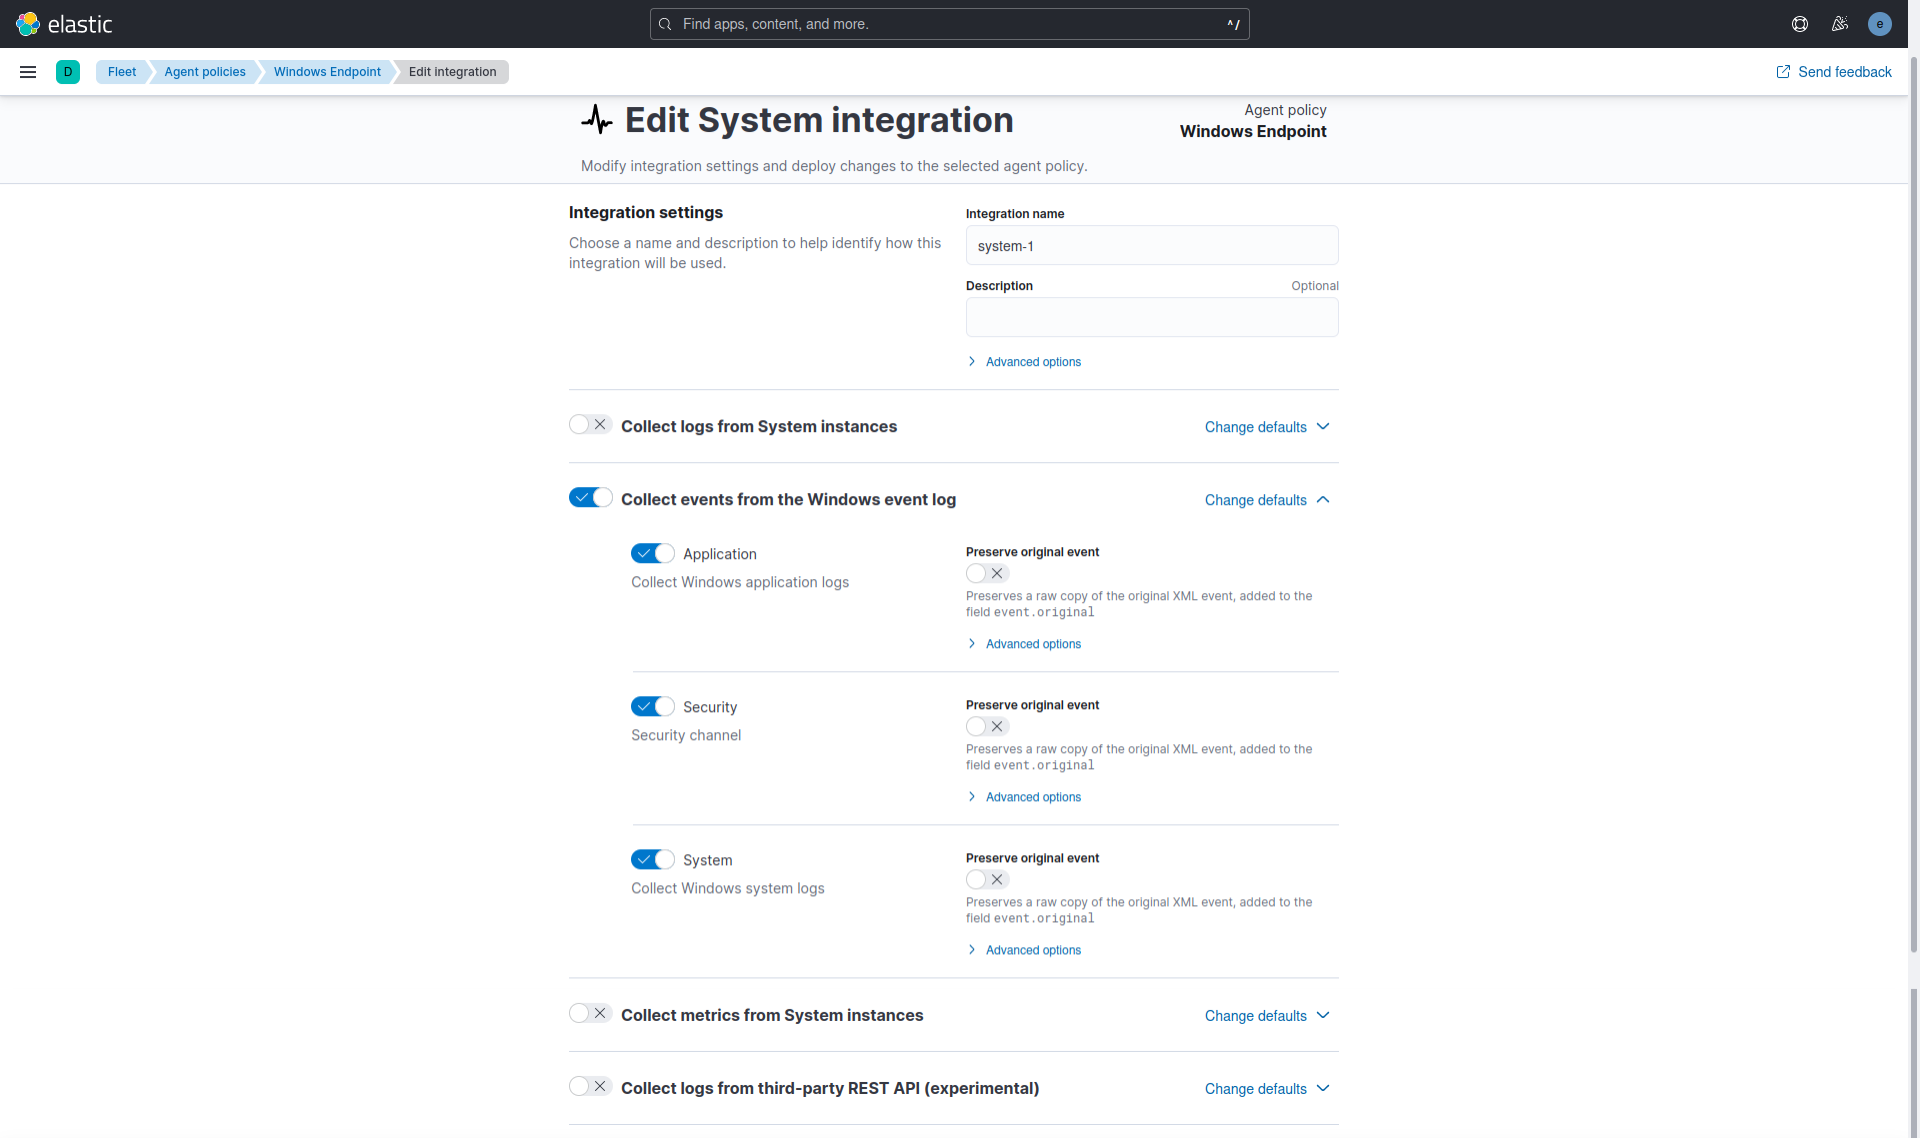
The System integration allows for monitoring servers, personal computers, and other devices. This integration collects metrics (state) and logs (events) from the devices. The data collected can be visualized in Kibana. Alerts can be created to notify if something goes wrong, and data can be referenced when troubleshooting an issue.
The System integration collects two types of data: logs and metrics.
- Logs help to keep a record of events that happen on the machine. Log data streams collected by the System integration include:
- On Windows machines:
application,system, andsecurity. - On macOS or Linux machines:
authandsyslog.
- On Windows machines:
- Metrics give insight into the state of the machine. Metric data streams collected by the System integration include:
- CPU usage, load statistics, memory usage, information on network behavior, and more.
In this configuration, only logs were collected.
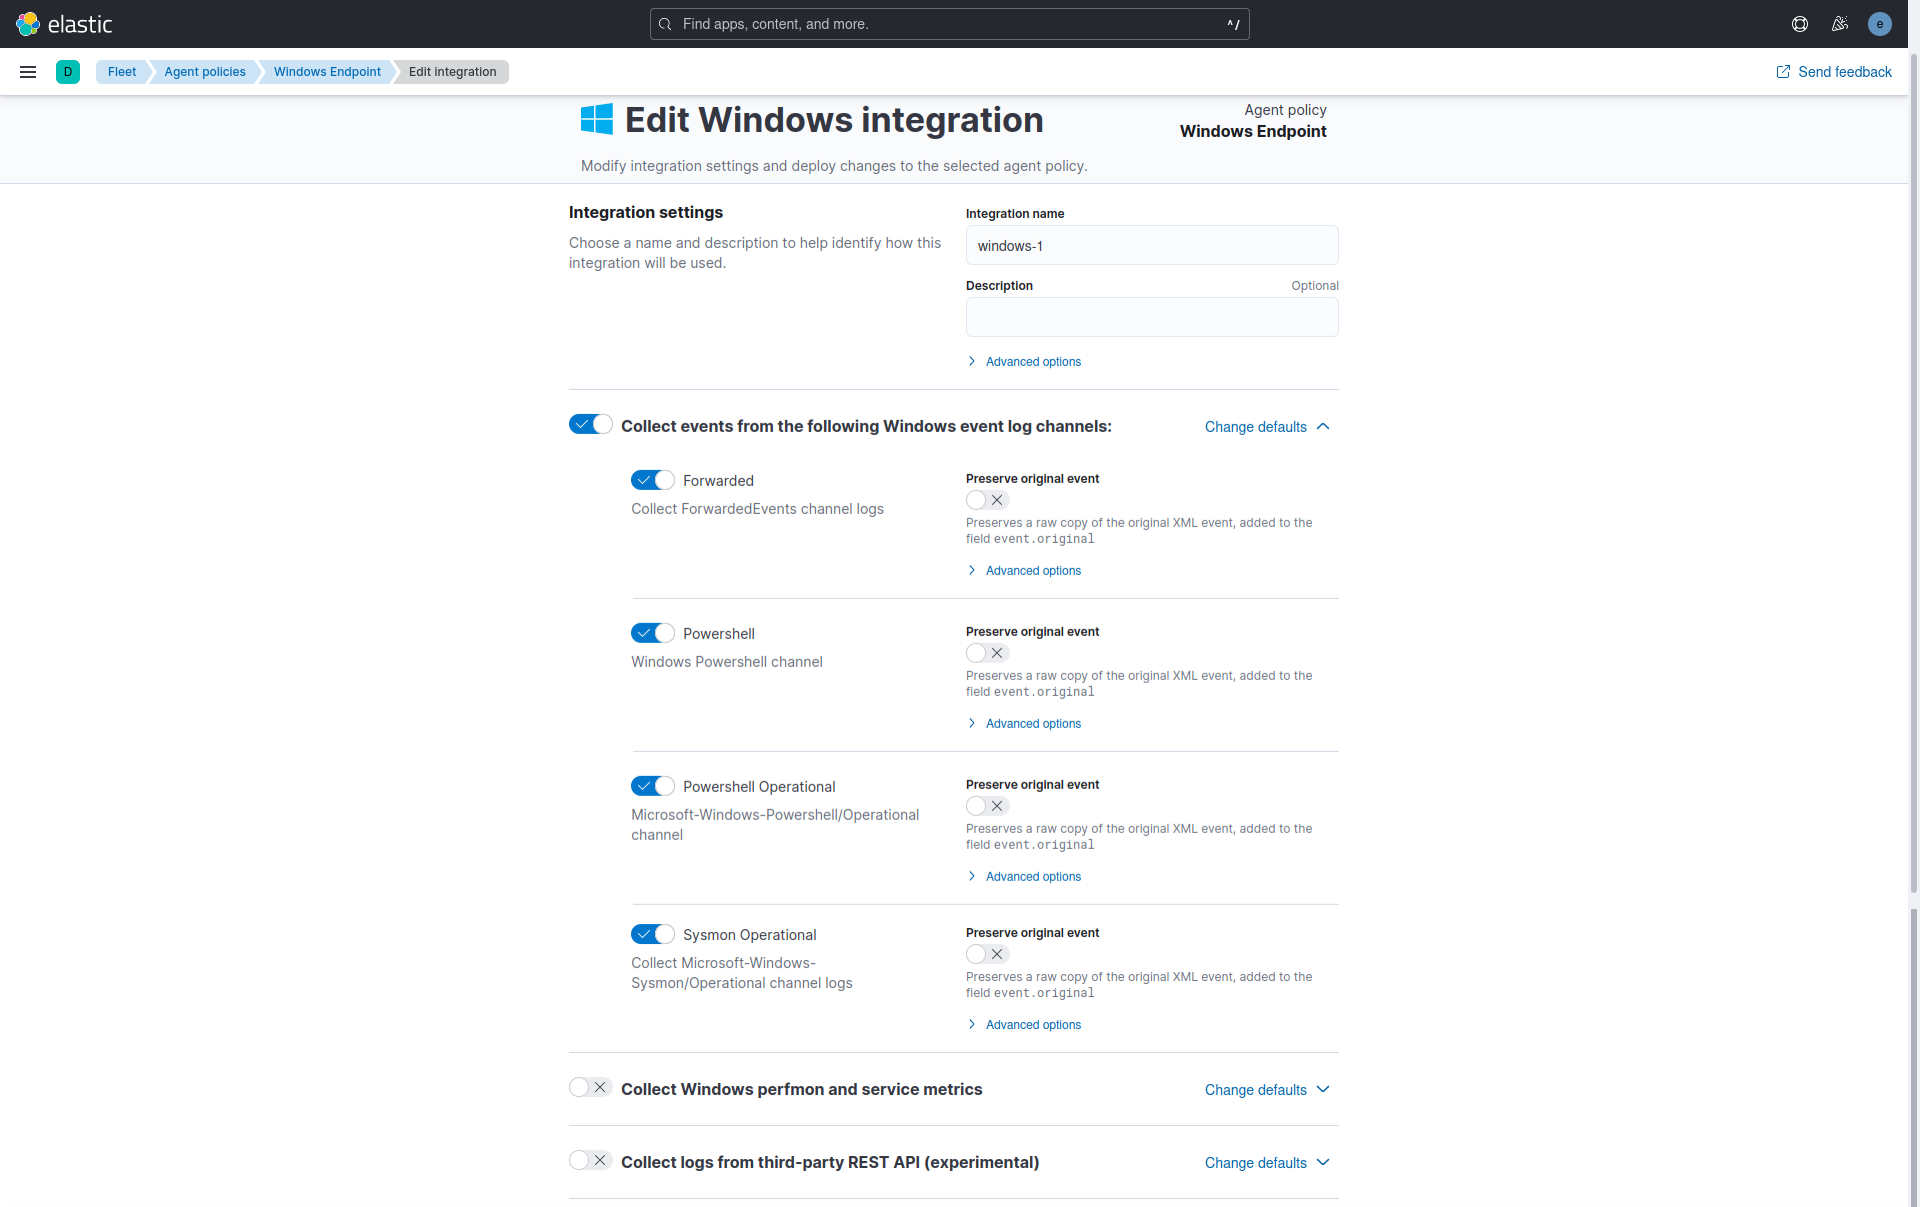
The Windows integration allows monitoring of the Windows OS, services, applications, and more. The Windows integration collects metrics (state) and logs (events) from the machine. These data can be visualized in Kibana, alerts to notify if something goes wrong can be created, and data can be referenced when troubleshooting an issue.
The Windows integration collects two types of data: logs and metrics.
-
Logs help to keep a record of events that happen on the machine. Log data streams collected by the Windows integration include:
forwarded events,PowerShell events, andSysmon events.
Log collection for the Security, Application, and System event logs is handled by the System integration.
-
Metrics give insight into the state of the machine. Metric data streams collected by the Windows integration include:
service detailsandperformance counter values.
In this configuration, only logs were collected.
The Elastic Defend integration provides prevention, detection, and response capabilities across Windows, macOS, and Linux operating systems running on traditional endpoints and public cloud environments. In this setup, Elastic Defend Malware protection was used for threat detection.
The Elastic Defend integration collects two types of data: logs and metrics.
- Logs - The log type of documents are stored in the
logs-endpoint.*indices. The following sections define the mapped fields sent by the endpoint:alerts,file,library,network,process,registry, andsecurity.
- Metrics - The metrics type of documents are stored in
metrics-endpoint.*indices. Metrics documents contain performance information about the endpoint executable and the host it is running on. The following section defines the mapped fields sent by the endpoint:metadata,metrics, andpolicy response.
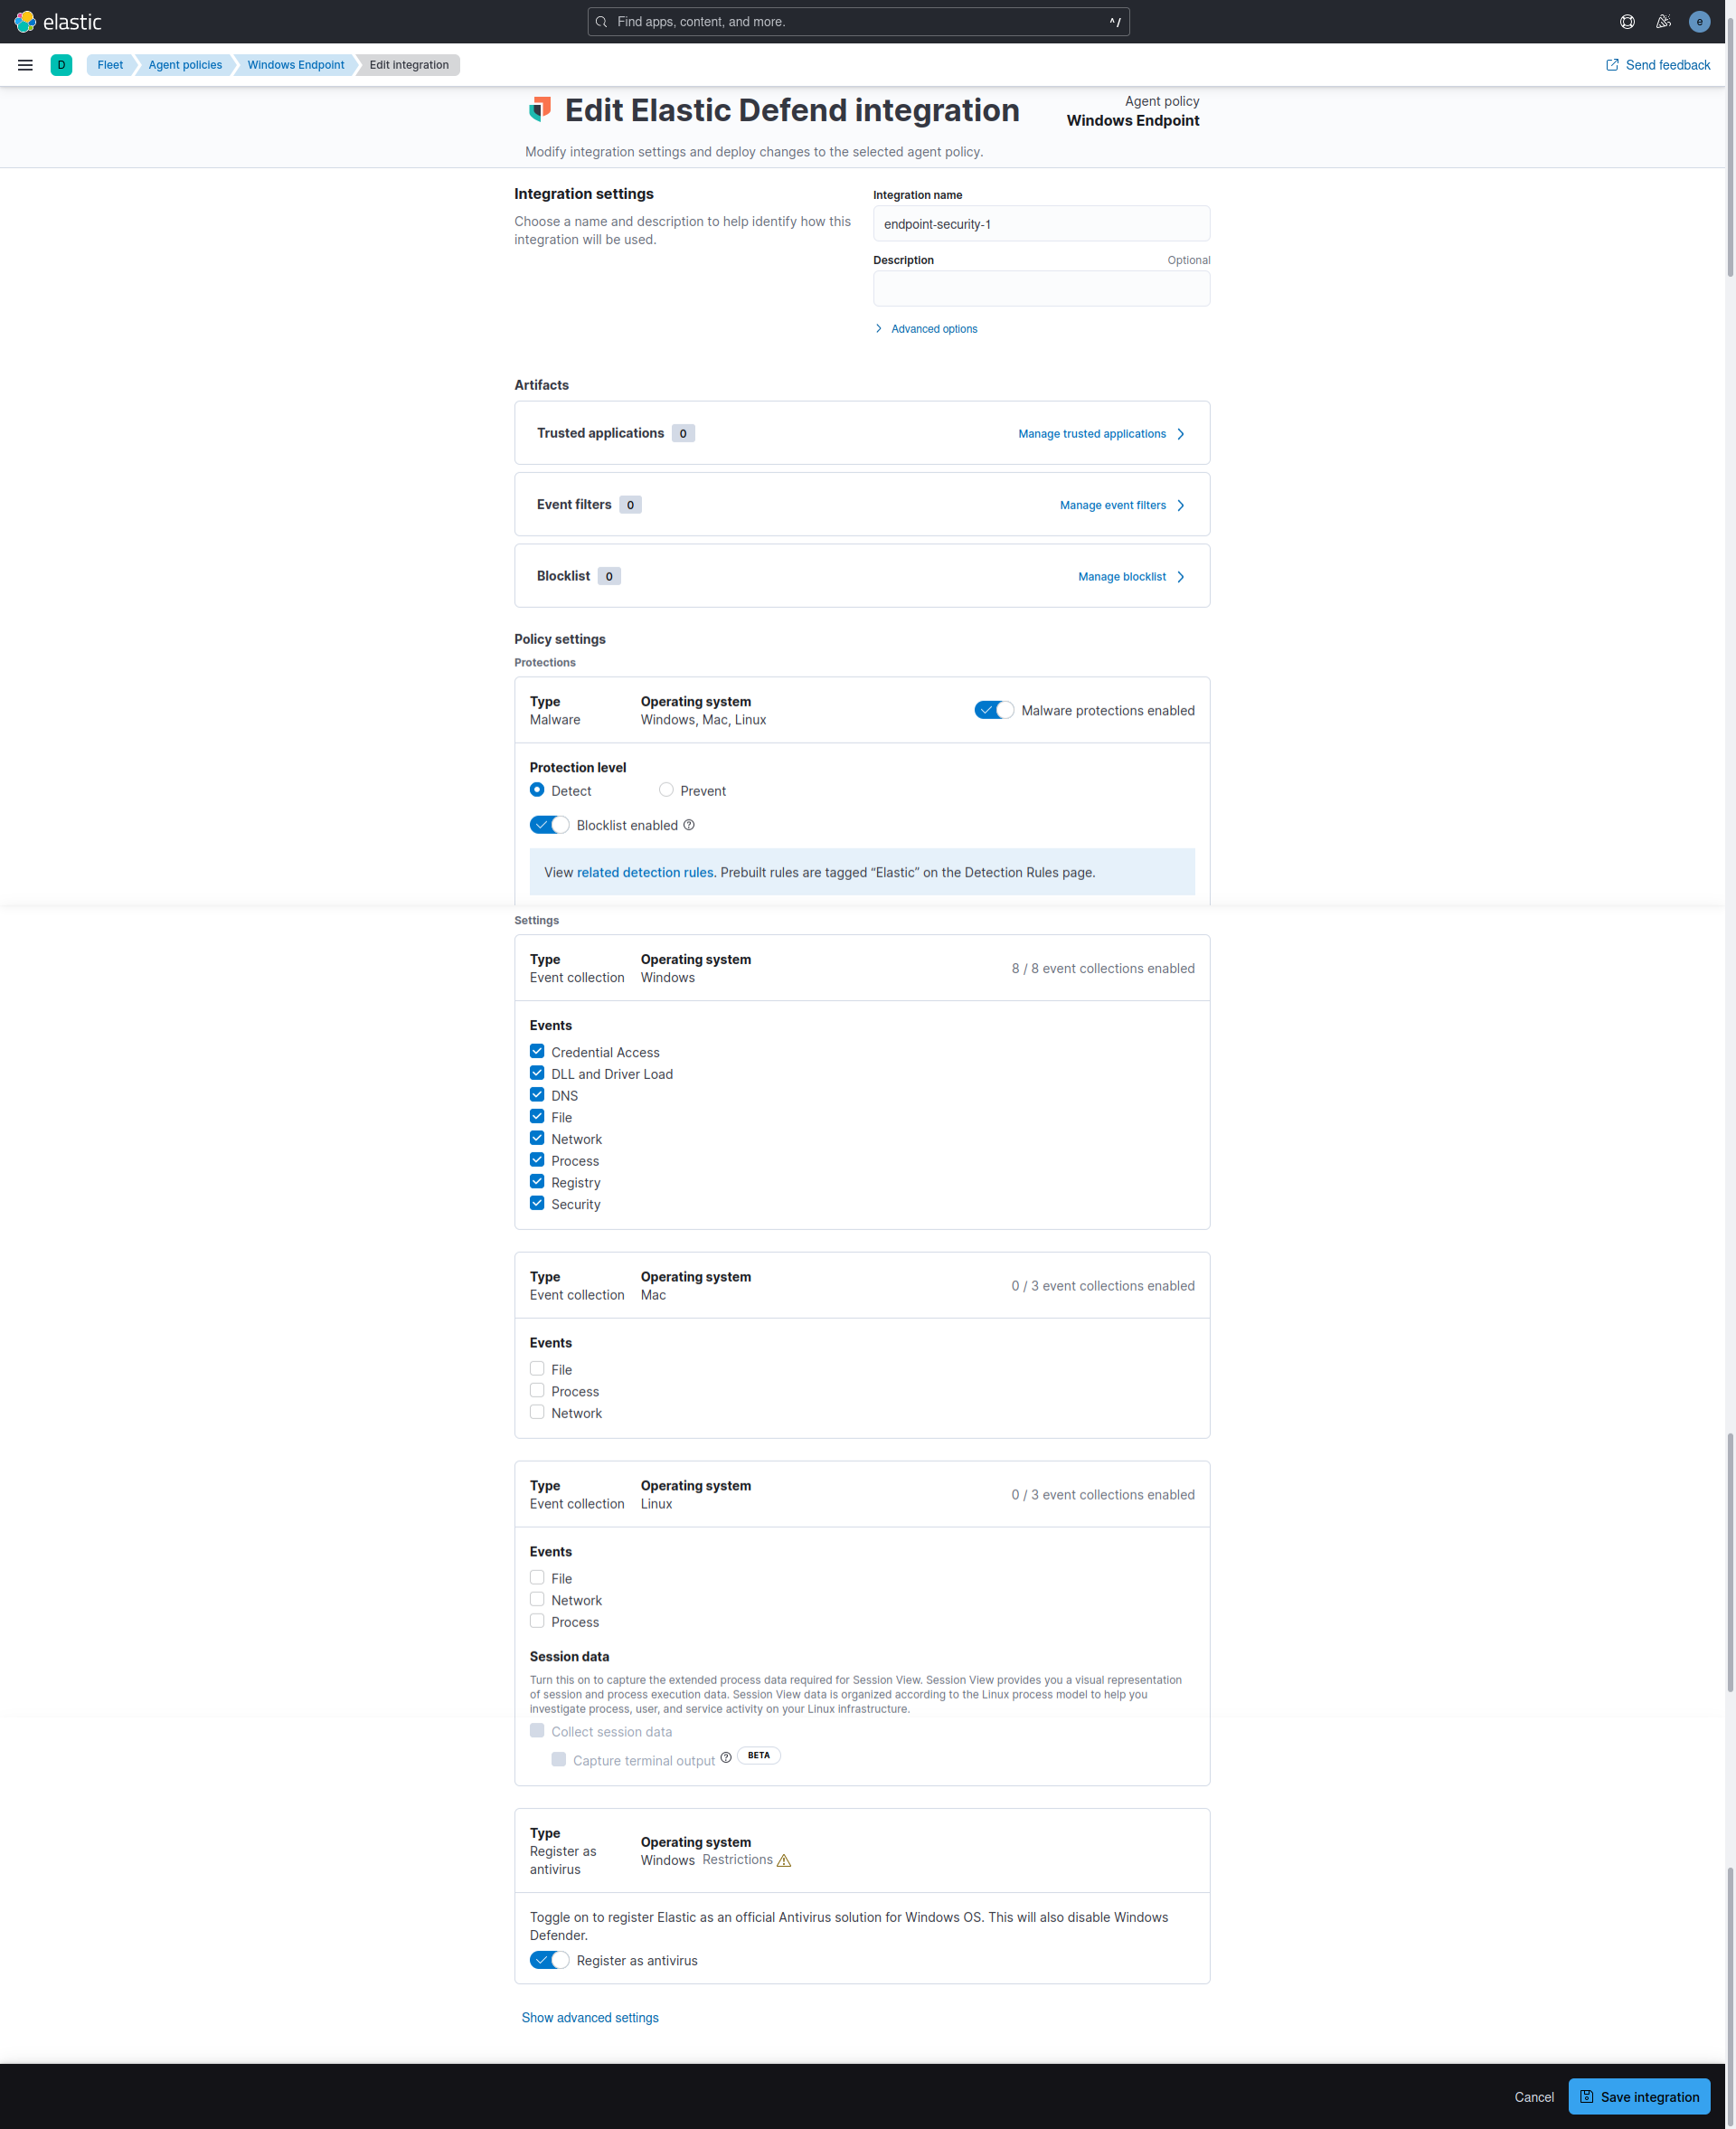
Malware protection was activated in Detect mode, and Elastic Security Antivirus was designated as the official antivirus solution for the Windows 10 virtual machine, automatically deactivating Windows Defender Antivirus.
The tests were performed with the Elastic Security Antivirus active and the SmartScreen for Microsoft Edge turned off.
The Elastic Security Antivirus, integrated with Elastic Defender, was employed instead of Microsoft Defender Antivirus. Alternatively, Microsoft Defender Antivirus can be used for testing, with Real-time protection disabled, to be able to save on disk the malicious files.
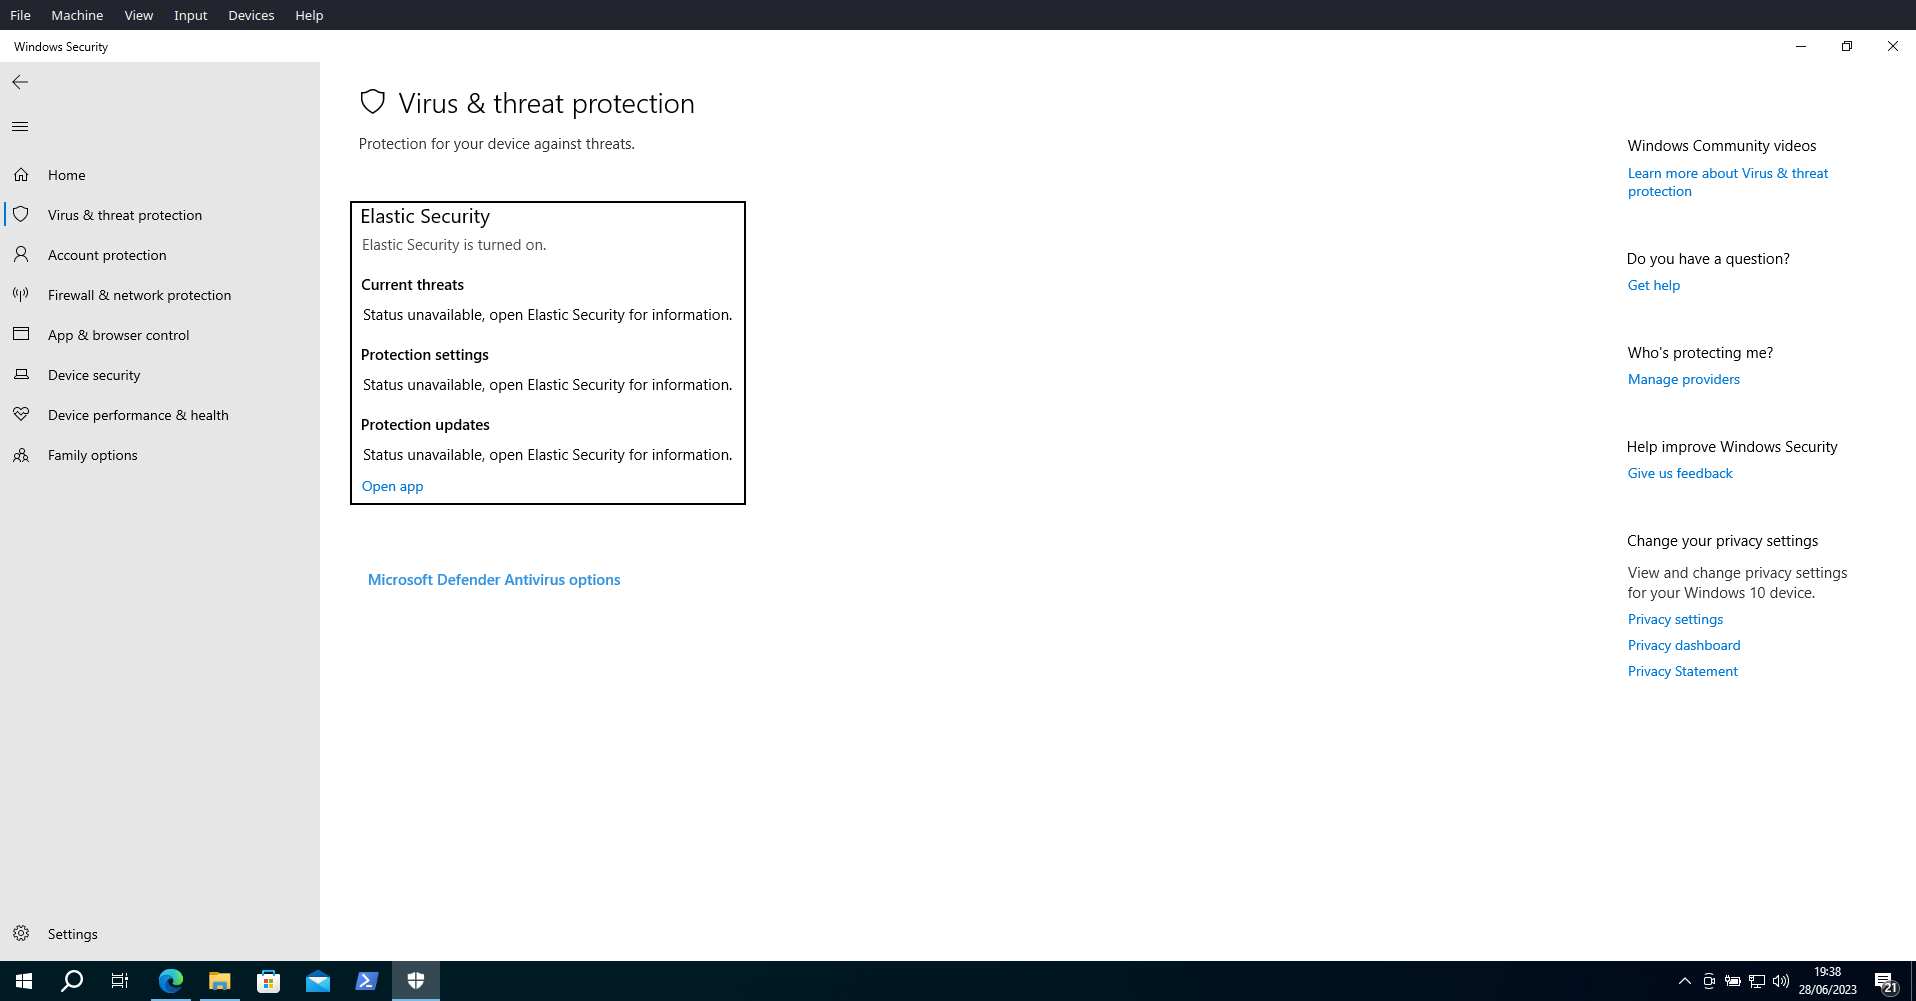
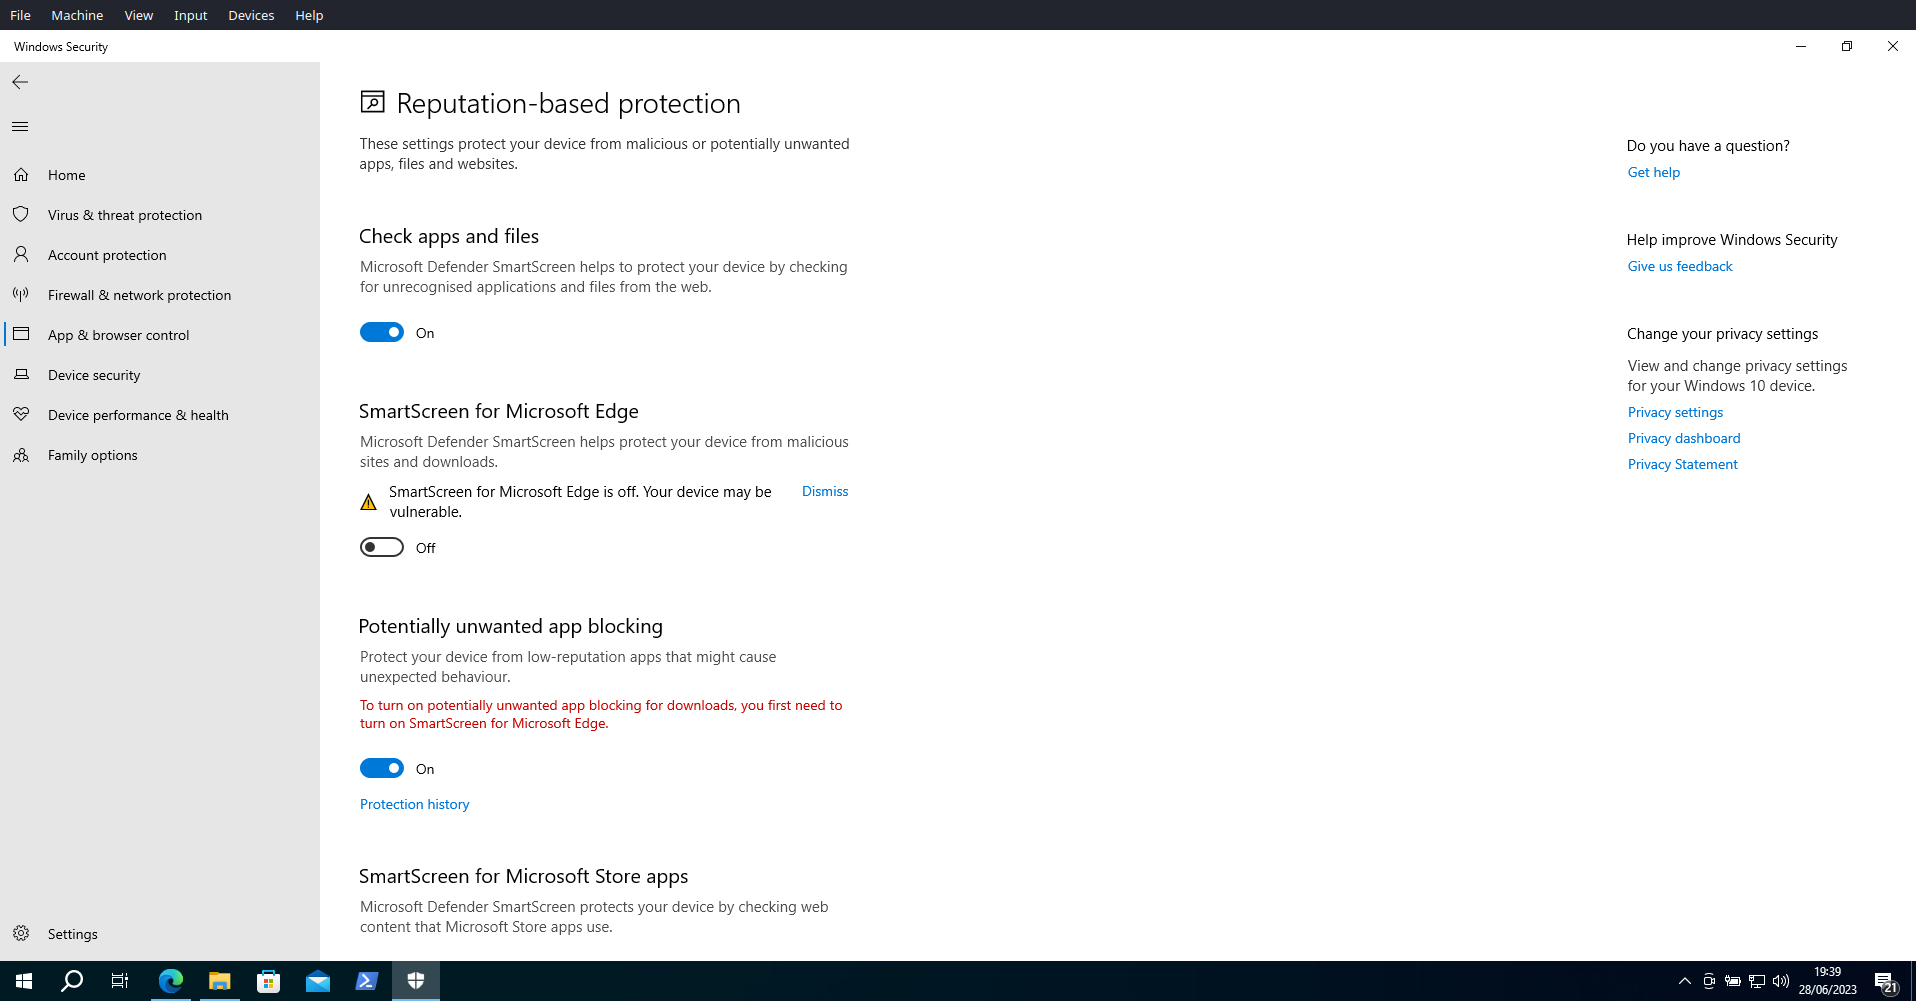
The SmartScreen for Microsoft Edge was turned off, enabling to download the malicious files in the EICAR Malware Test.
The EICAR Ant-Virus Test File or EICAR test file is a computer file that was developed by the European Institute for Computer Antivirus Research (EICAR) and the Computer Antivirus Research Organization (CARO) to test the response of computer antivirus (AV) programs.
The EICAR test file is one of the most well-known security strings that can be used to check the level of protection an antivirus software can offer. The EICAR Standard Anti-Virus Test File contains the ASCII string which, when interpreted by the command processor, returns the message string to the standard output and exits back to the command prompt. This test file holds a simple text file, called eicar.com, containing the ASCII string, which they use in scanning files.
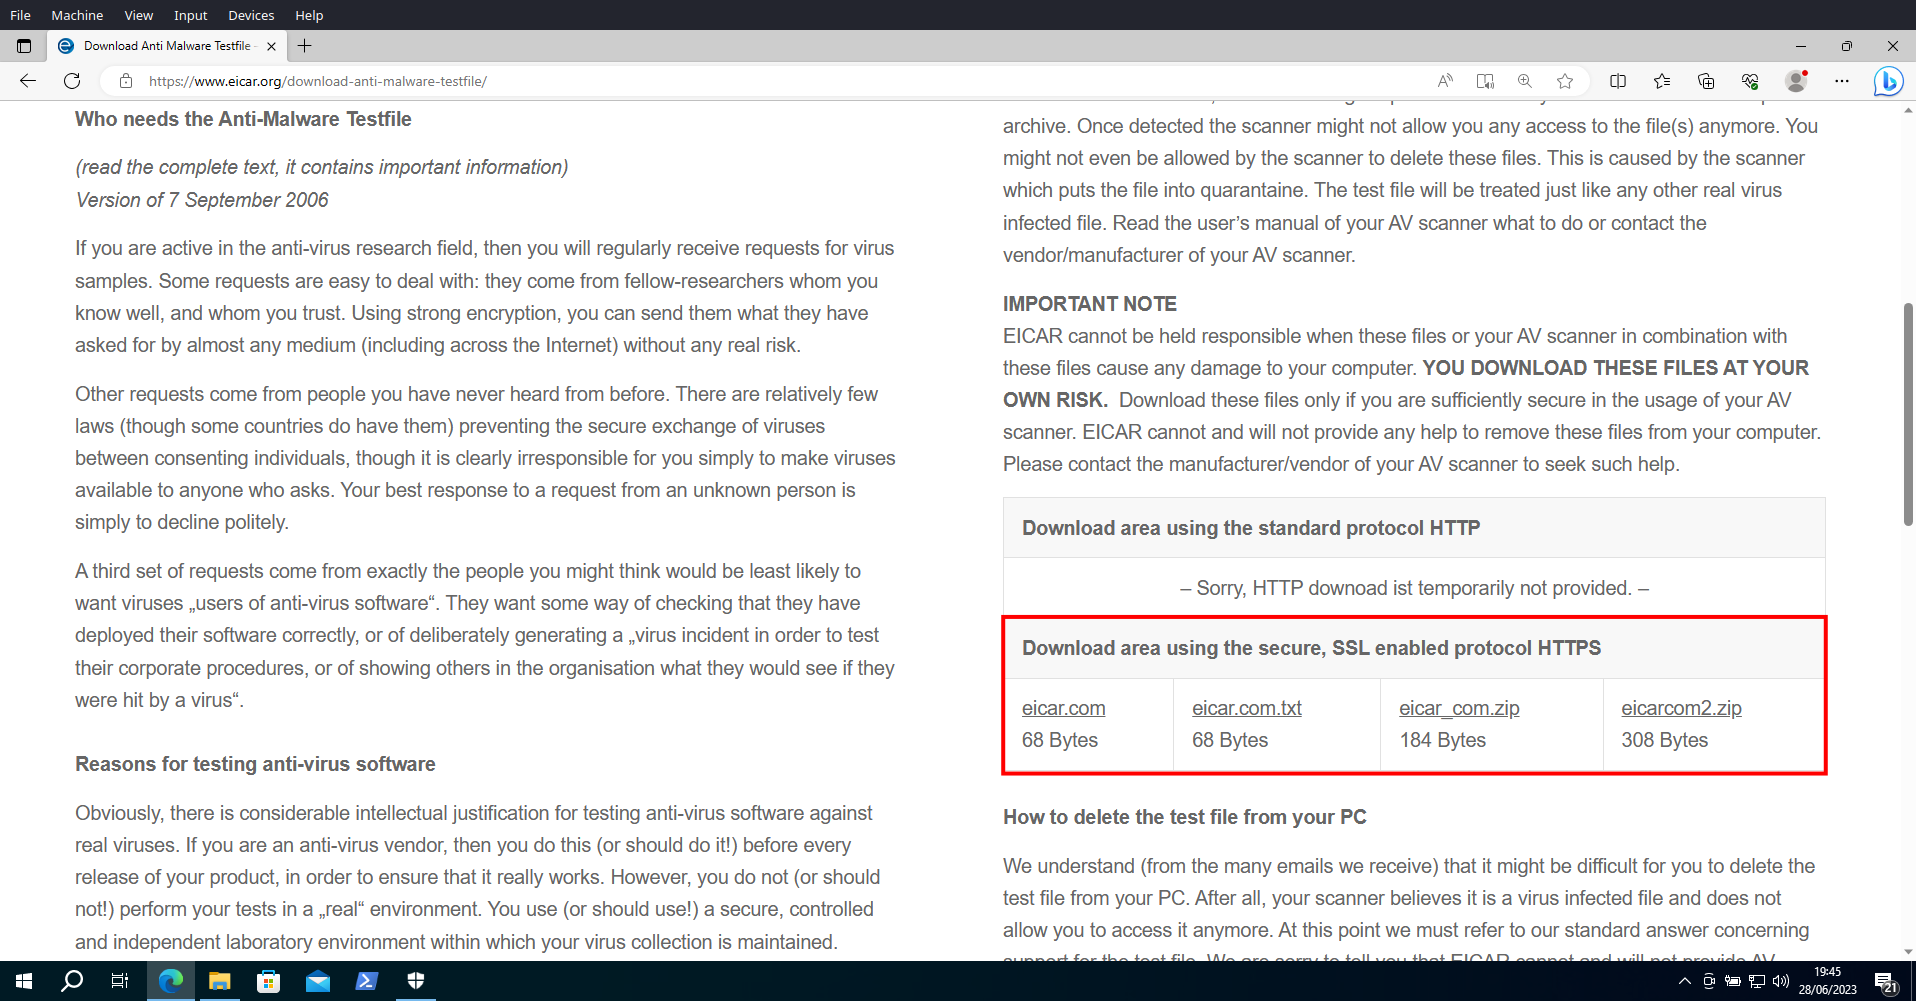
In the EICAR website, under the Download area using the secure SSL-enabled protocol HTTPS, the four versions of the eicar.com file can be downloaded: the original file, the eicar.com.txt variant, and two compressed files, one with eicar.com compressed one time (eicar_com.zip) and the other compressed two times (eicarcom2.zip).
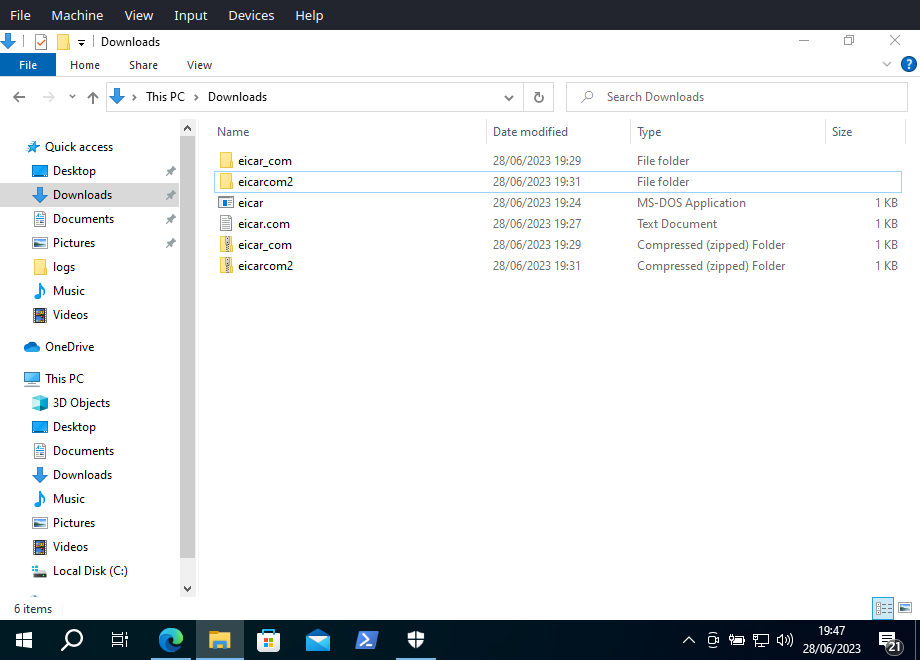
The image below displays the Download folder on the Windows 10 VM with the downloaded and extracted EICAR files.
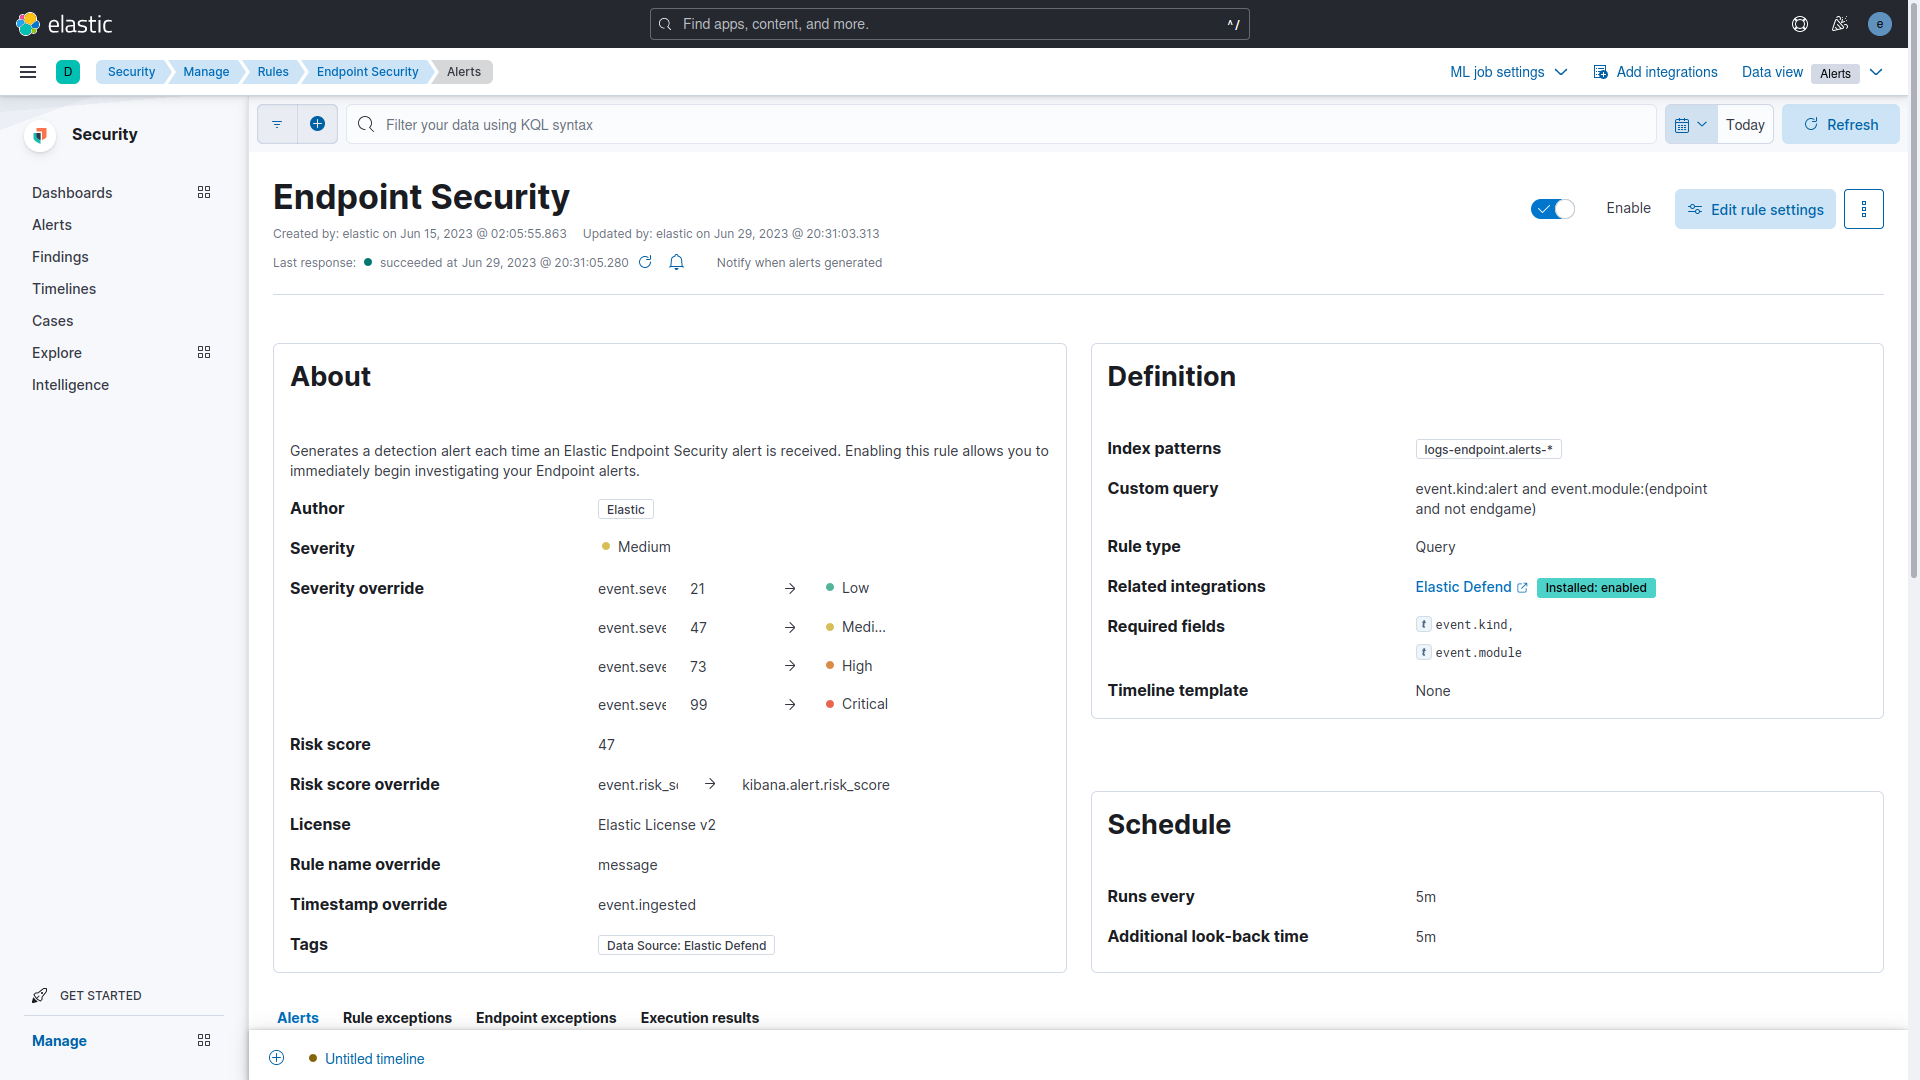
The Endpoint Security Rule generates a detection alert (signal event) each time an Elastic Endpoint Security alert event is received. Enabling this rule allows the investigation of Endpoint alerts on Elastic Security. This rule was the only rule enabled to perform the EICAR Malware Test.
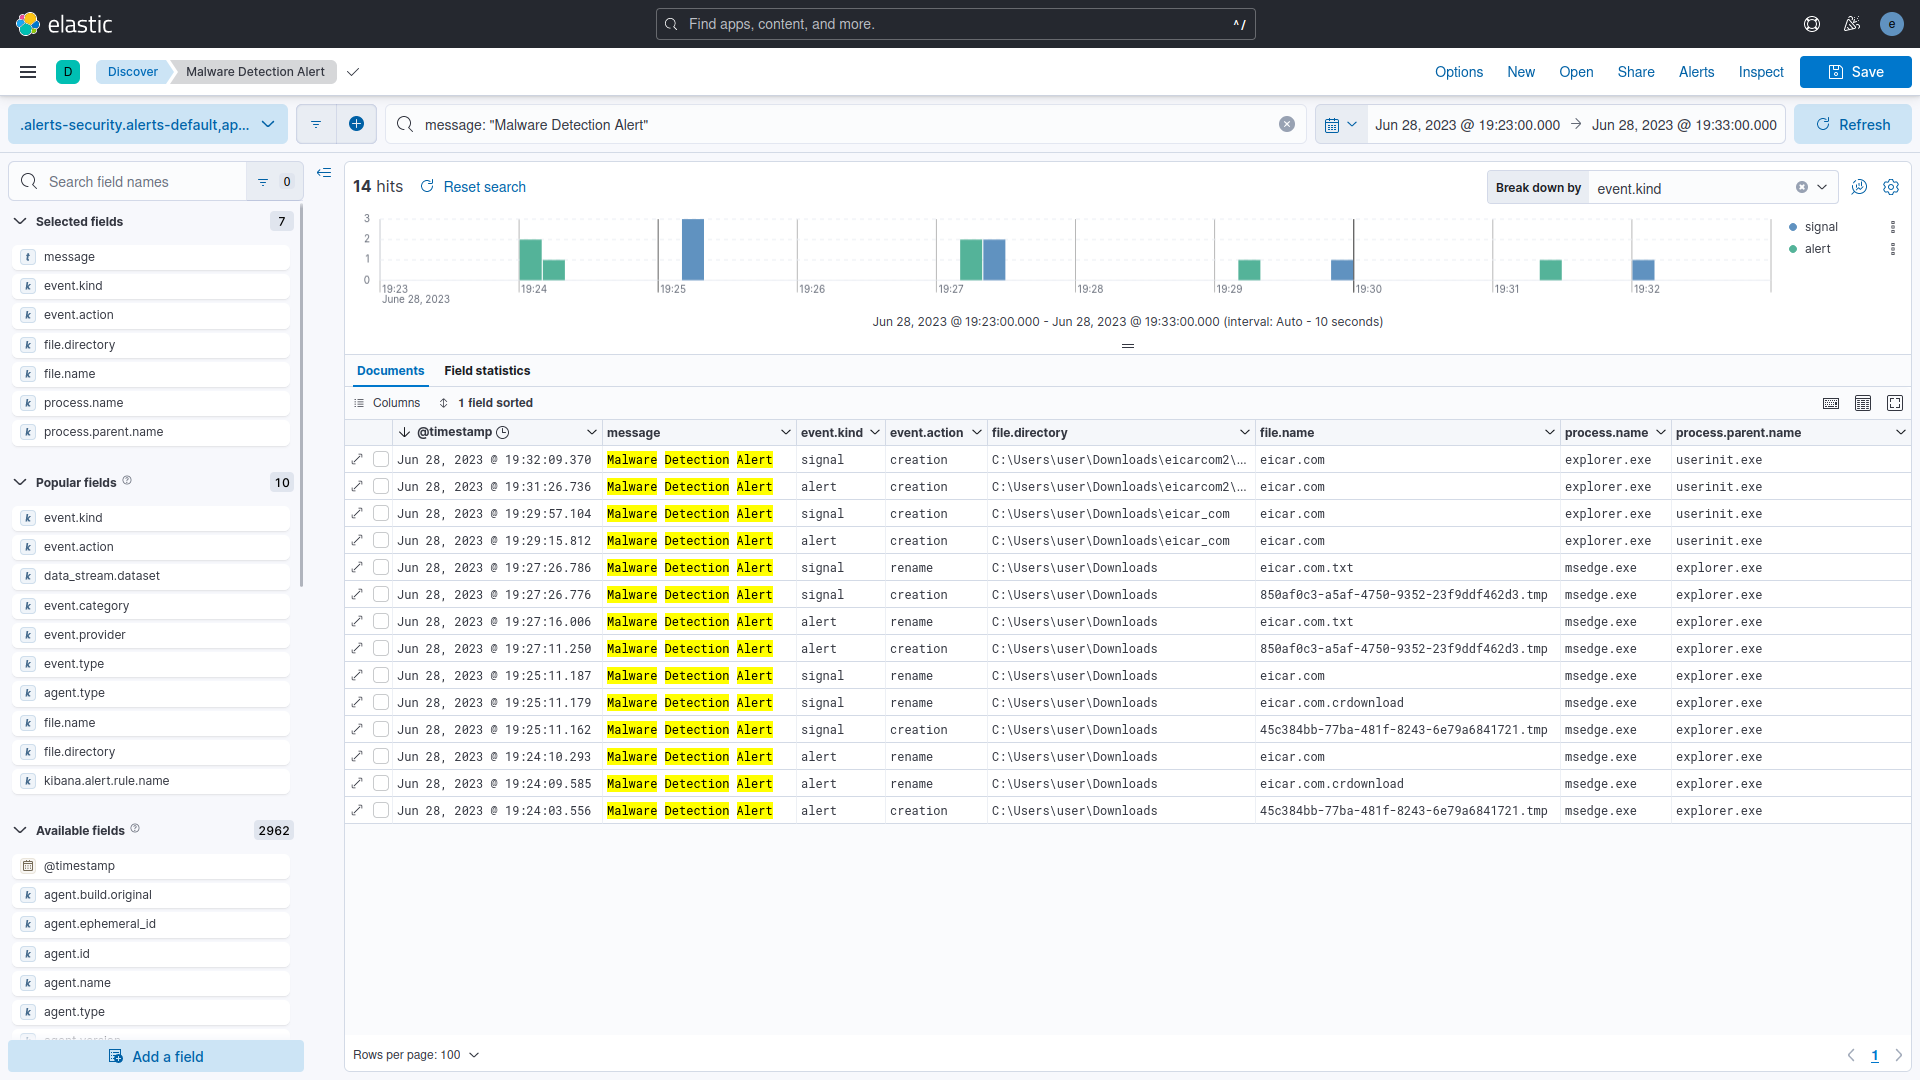
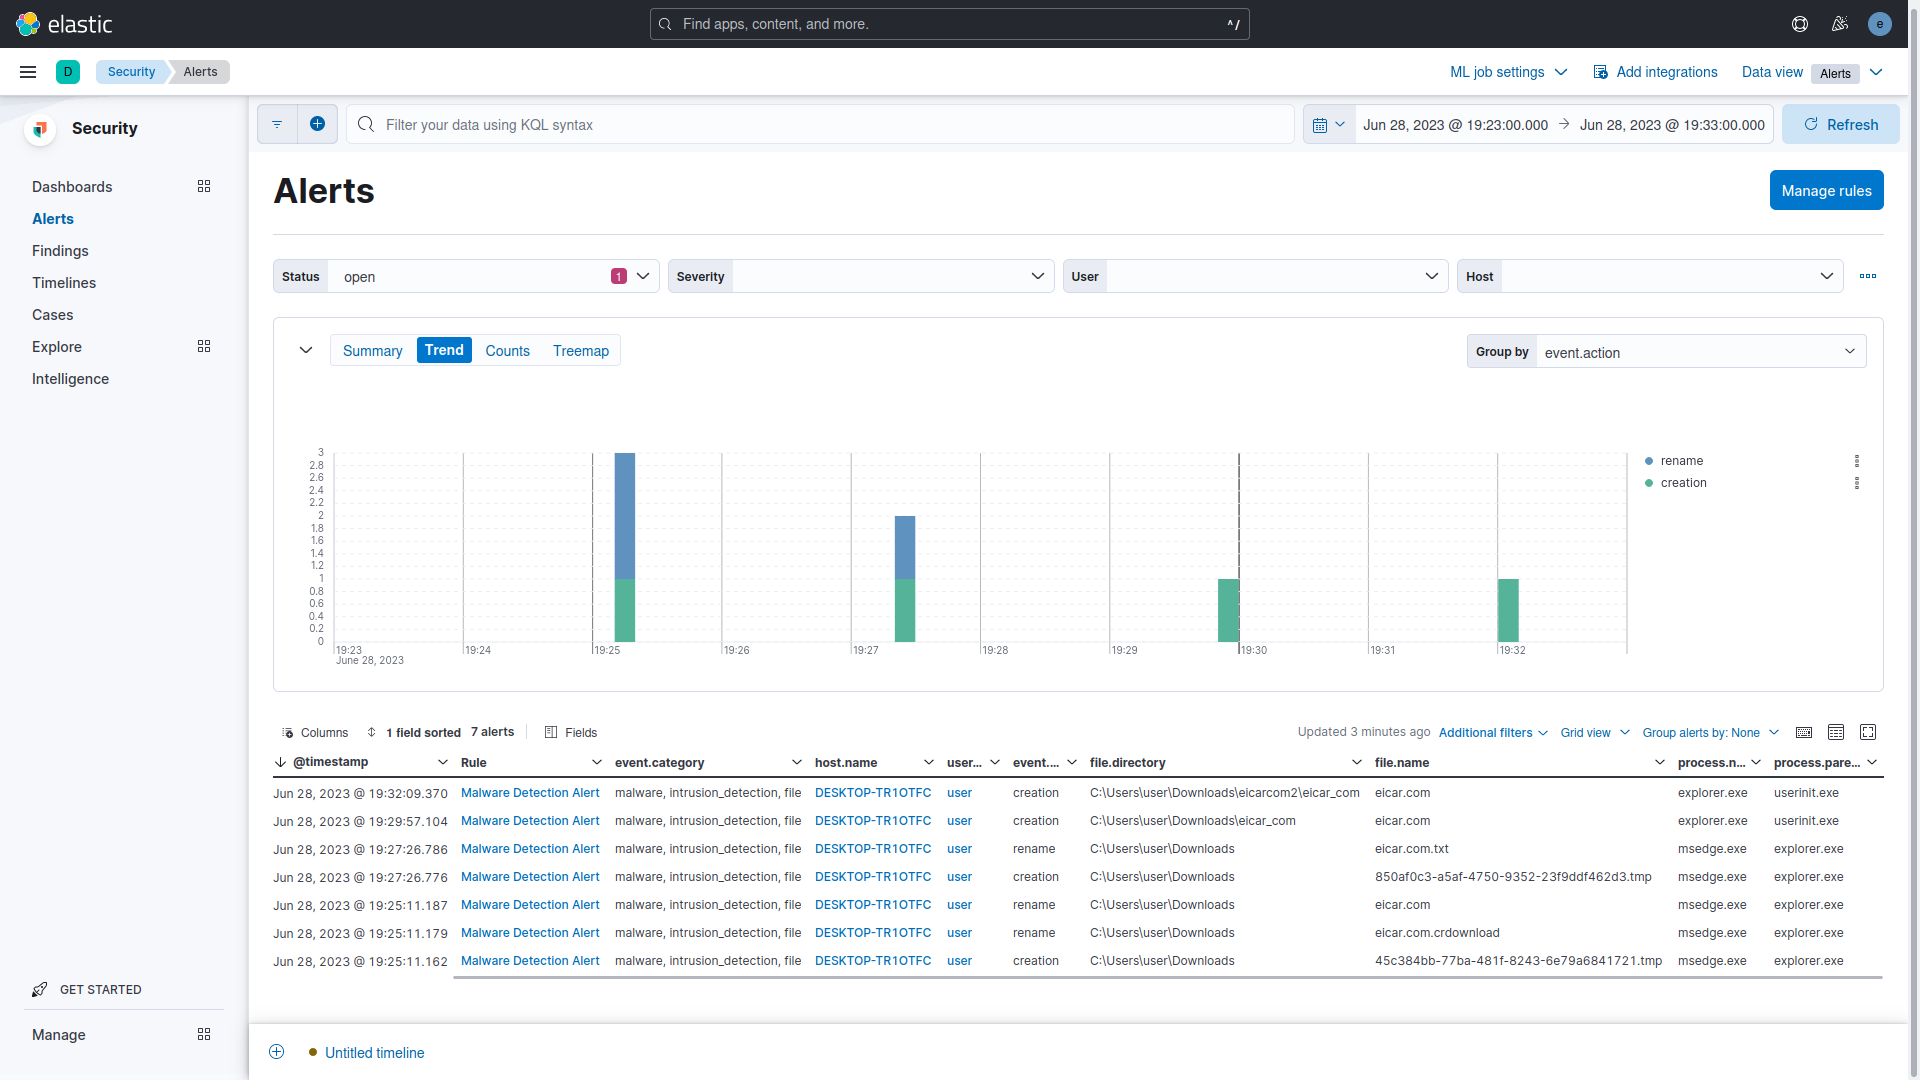
In the existing setup, downloading the EICAR Malware Test's four files results in 16 events. Elastic Endpoint Security sends 8 alerts used by the Endpoint Security Rule to generate 8 signals. When the eicar.com file is downloaded, Elastic Endpoint Security triggers three alerts: one for creating a *.tmp file and two for renaming the eicar.com.crdownload and eicar.com files. The same pattern occurs with the eicar.com.txt file. During the extraction of the compressed files, each eicar.com file triggers one alert. The test using the filter message "Malware Detection Alert" identified 14 events: 7 alerts and 7 signals. Notably, the renaming of the *.tmp to eicar.com.txt.crdownload file was not detected in the trial.
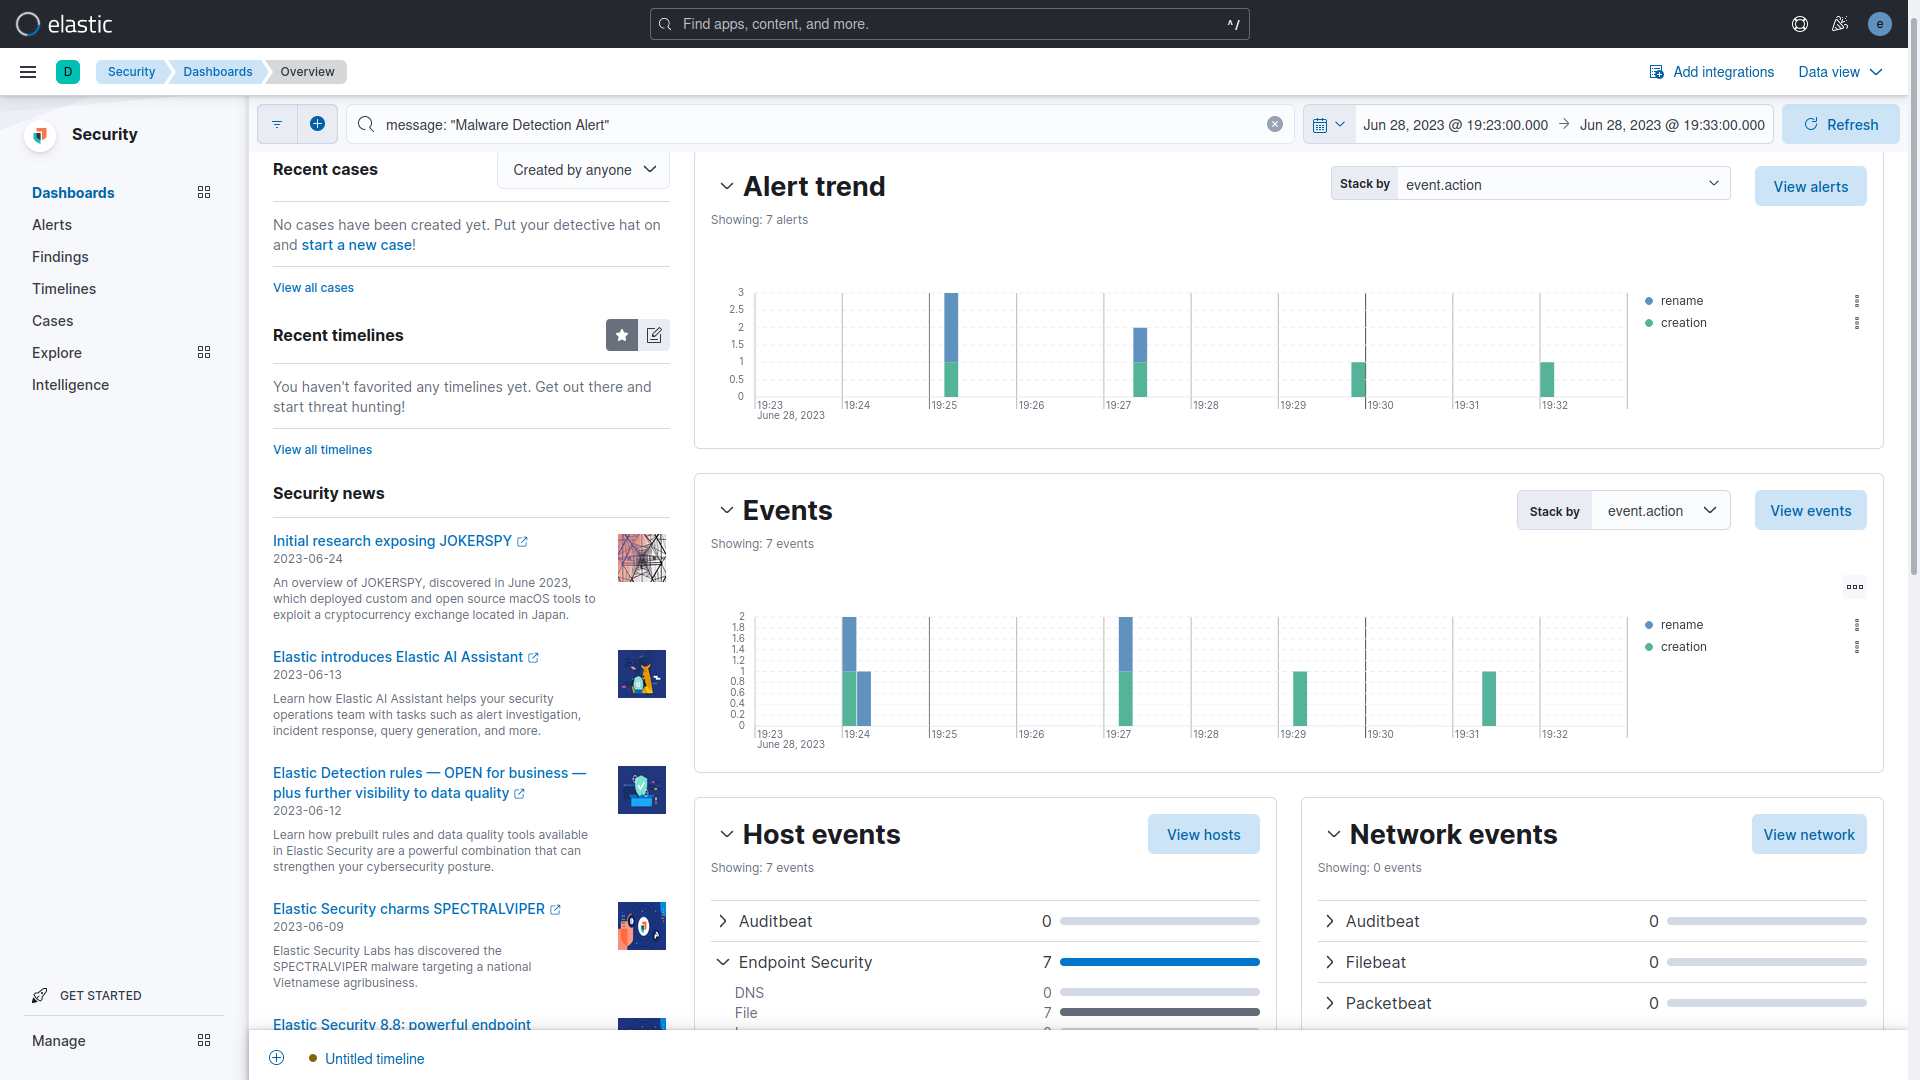
On the Security > Dashboards > Overview page, apply the filter message: "Malware Detection Alert". In the Events section, observe the 7 alert events received from Elastic Endpoint Security. At the top of the Alert Trend section, view the 7 signal events generated by the Endpoint Security Rule. In the Host Events section at the bottom, confirm that the 7 events sent by Endpoint Security belong to the File category.
In the Security > Alerts section, there are 7 alerts (signal events) displayed. These alerts were triggered by the Malware Detection Alert rule. Among these, there are four creation events for individual files and three rename events for eicar.com.crdownload, eicar.com, and eicar.com.txt.
RTA offers a framework of scripts created to enable blue teams to assess their detection capabilities against malicious tradecraft. This framework is inspired by MITRE ATT&CK and designed for comprehensive testing. RTA is composed of Python scripts that generate evidence of over 50 different ATT&CK tactics, as well as a compiled binary application that performs activities such as file time-stopping, process injections, and beacon simulation as needed.
Whenever possible, RTA tries to execute the described malicious activities. In some instances, the RTAs will mimic the entire or partial activity. For instance, certain lateral movements primarily target the local host (although parameters often allow multi-host testing). In other cases, executables like cmd.exe or python.exe might be renamed to create the illusion of a Windows binary engaging in non-standard actions.
To conduct the MITRE ATT&CK Test using RTA, all rules in Security > Manage > Rules on Kibana were activated, excluding the My First Rule, Multiple Alerts Involving a User rule, and Multiple Alerts in Different ATT&CK Tactics on a Single Host rule. Moreover, any rules marked as Failed or Warning in the Last Response field were deactivated.
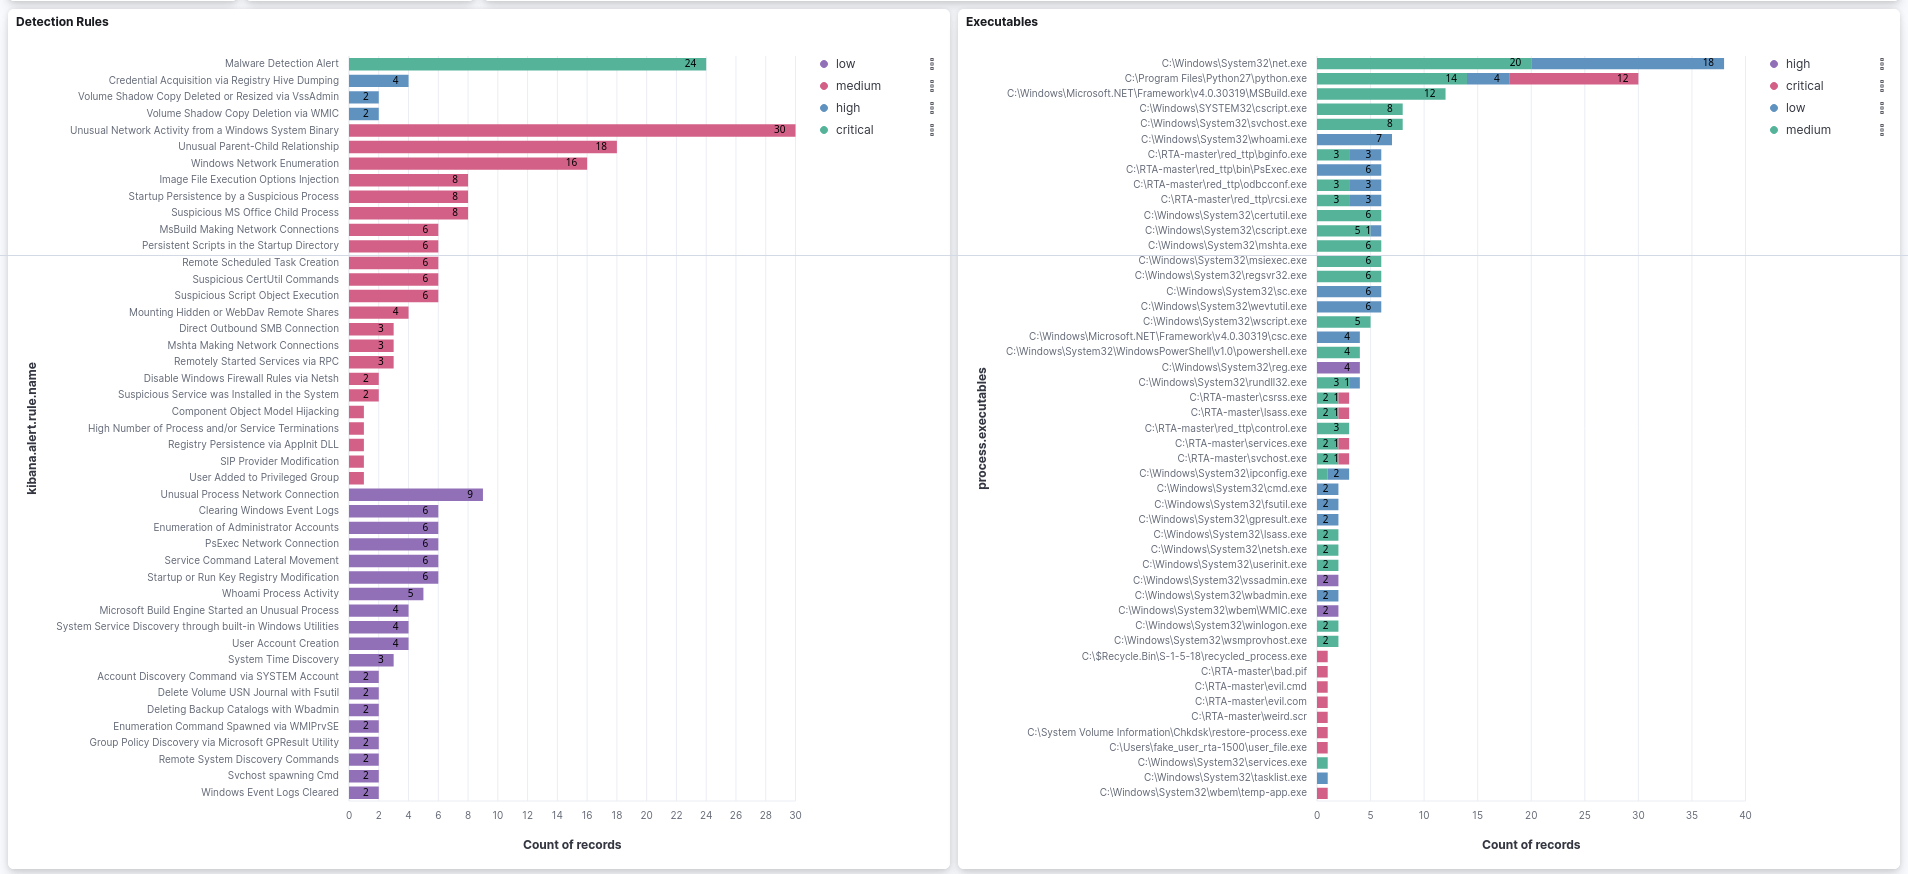
After running the run_all.py python scrip on RTA-master directory, the test completed in under 15 minutes and produced 247 signal events detected by 45 rules, identifying the actions of 25 Python scripts utilizing 49 distinct executables. The chart displayed below illustrates the progression of these signal events throughout the test period.

The chart on the left displays the 45 Security SIEM detection rules utilized to generate alerts (signal events). These rules are sorted and color-coded based on their severity classification. On the right, the chart exhibits the 49 detected executables, sorted by the number of records. The executables are also color-coded in accordance with the event's severity classification.
The chart displays 25 Python scripts identified in the test. These scripts are arranged by record count and color-coded according to event severity classification.

This chart illustrates the top 10 rules by the record count. The parent process is shown on the left axis, and the child processes are depicted in the legend.
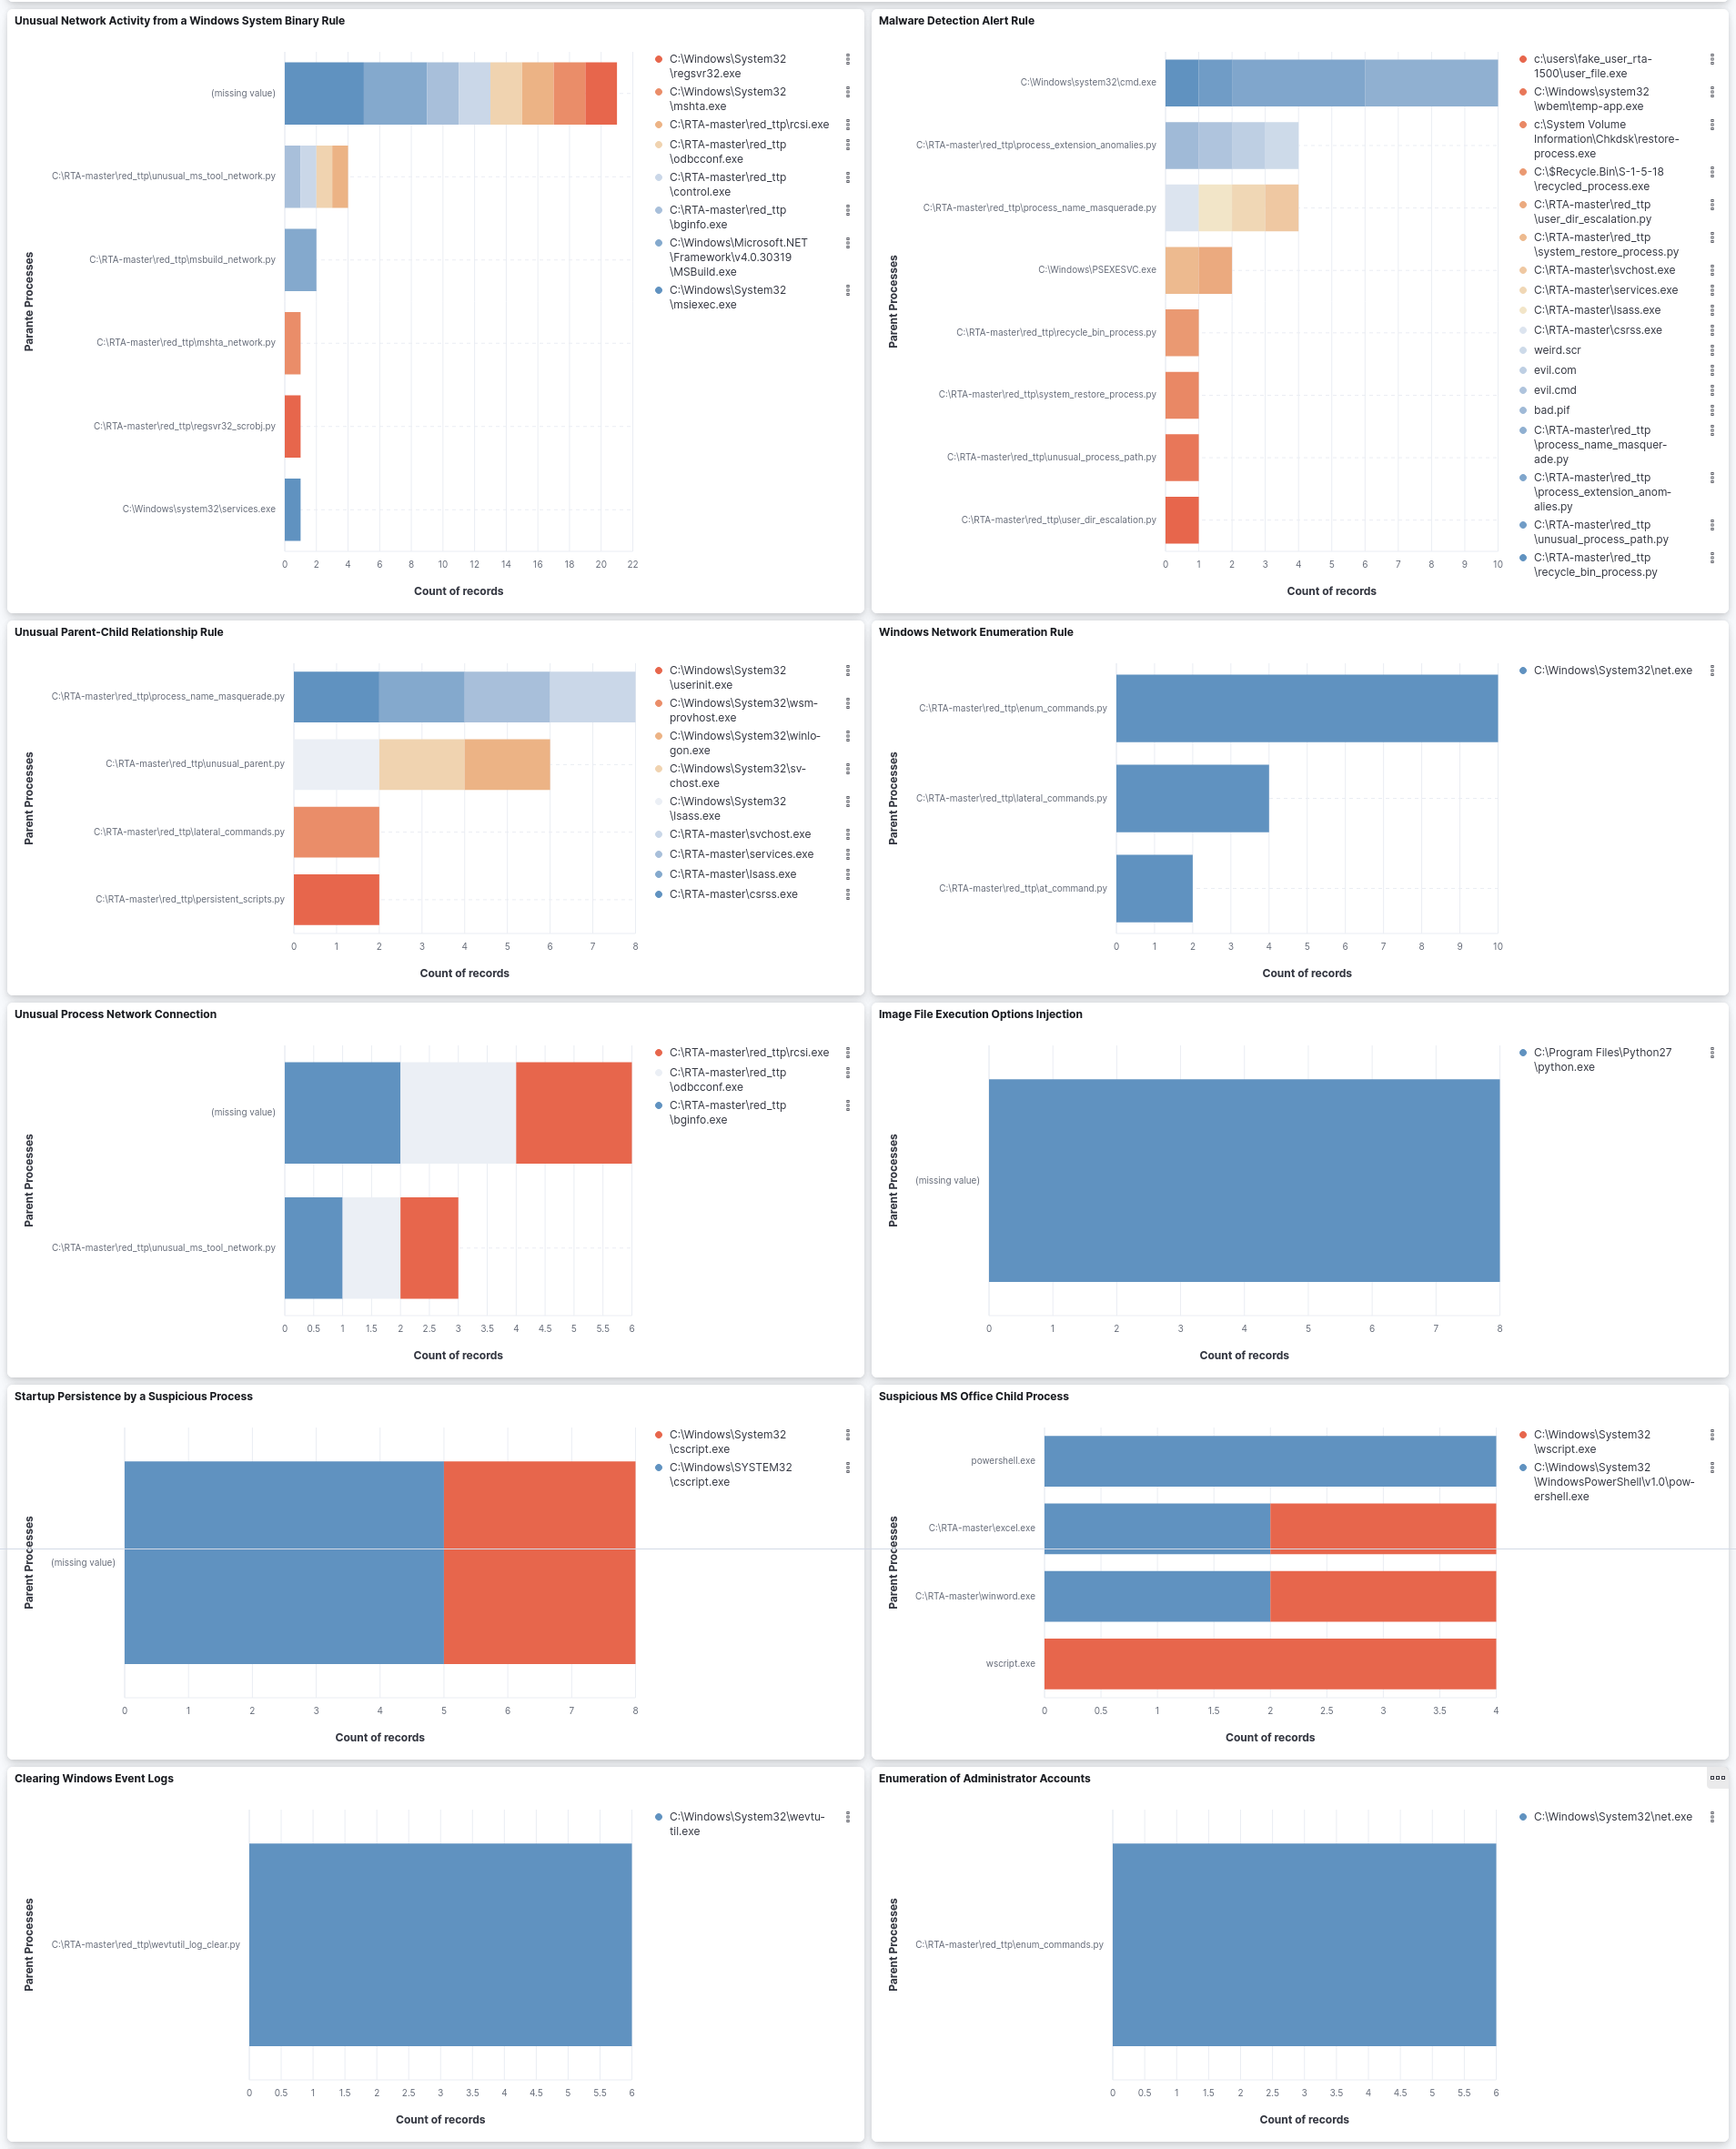
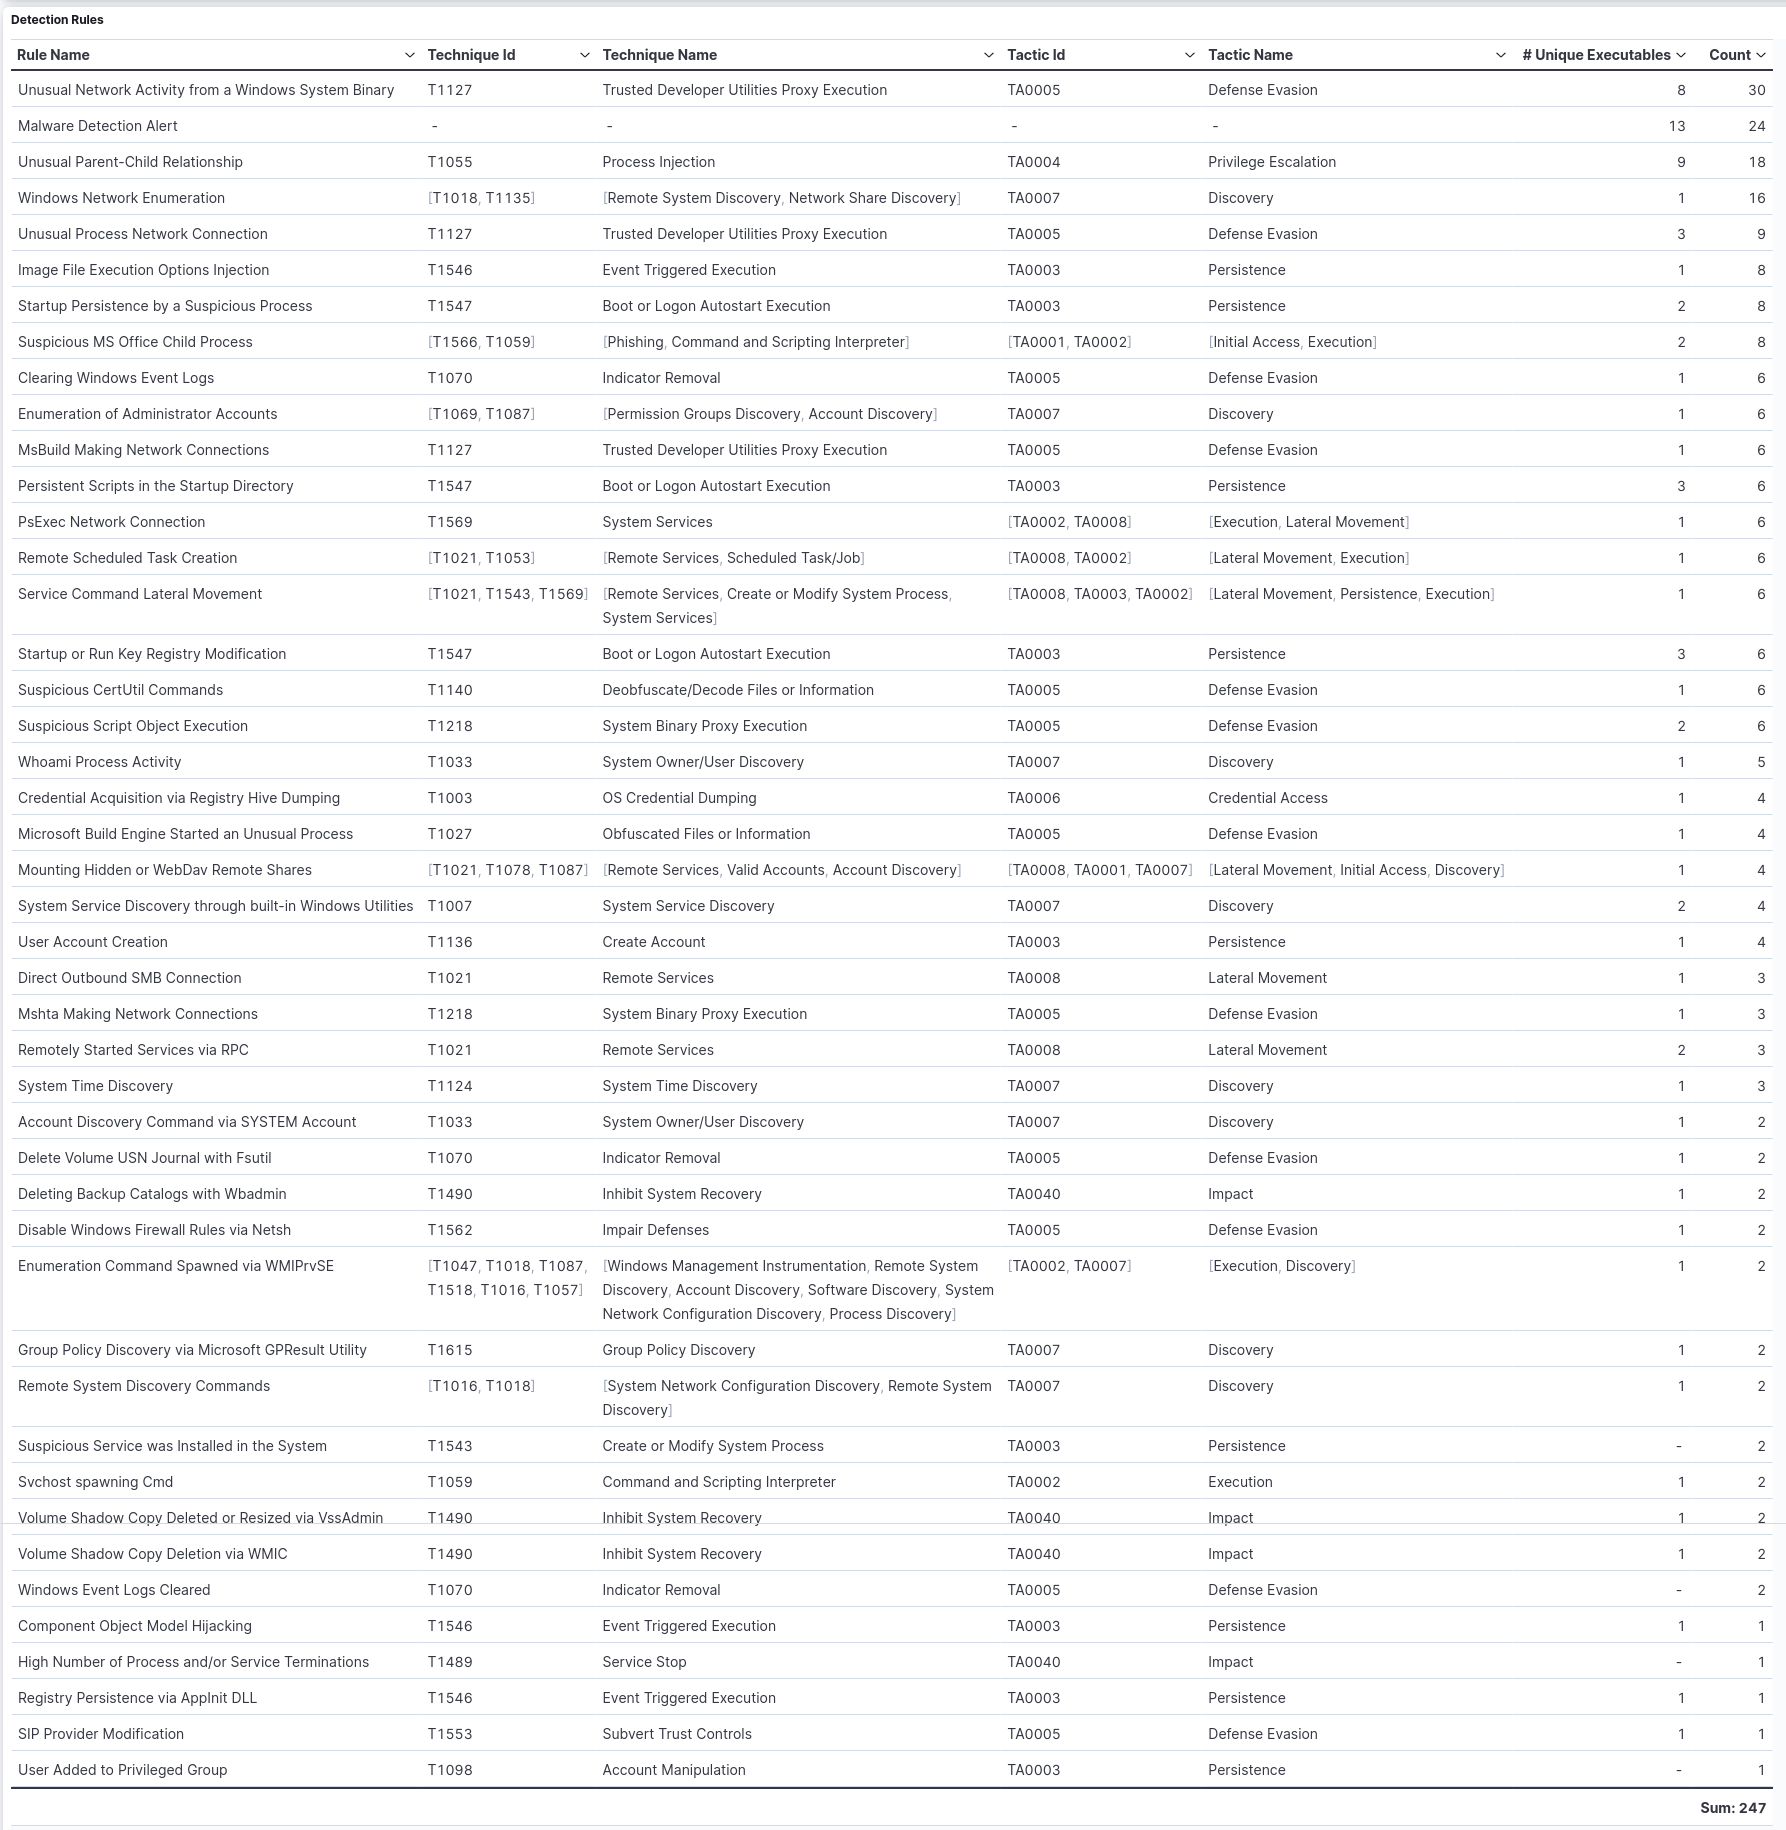
Table listing 45 detection rules, including their ID and name for the associated technique and tactic, along with the number of unique executables detected by each rule and the count of signal events generated by the rule.
The table below presents the commands executed in the process, along with the parent process, for each activated rule in the test. It also displays the username associated with each command, as well as the event action and severity.


