Rob Savage
The purpose of this exercise was to utilize APIs to analyze weather data from 500+ random countries and use that data to help automate what would be exhaustive travel destination research.
-
Python (Data Aggregation/Cleaning)
- Pandas Library
-
Github (Publishing of Results and Analysis)
-
Jupyter Notebook
-
Matplotlib (Visualizations)
-
SciPy
-
Used
Pythonto aggregate/clean data pulled from OpenWeather withPandas. -
Once the data was inspected and cleaned, various plots with
Matplotlibwere created in order to inspect relationships among the different features.
-
A cleaned
csvwas exported from the data frame -
That new dataset was then opened in a new notebook, then appended with information from Google Maps
-
Utilizing a few filters to decide upon ideal weather conditions, the best cities were chosen
-
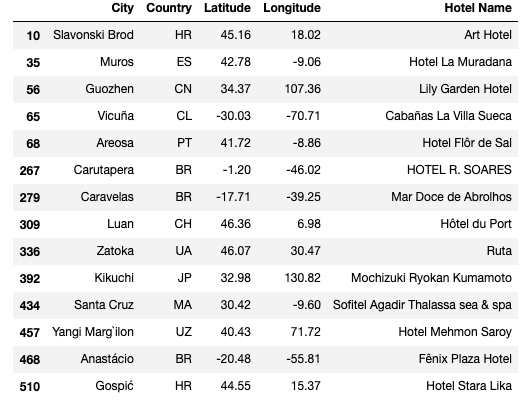
Google APIs was then utilized to find the nearest hotels in those few cities
-
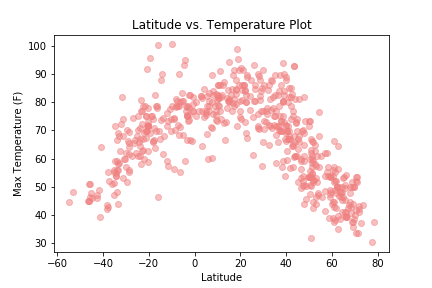
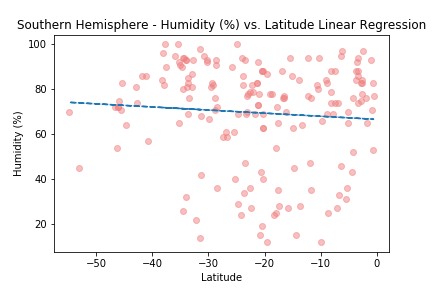
As advertised, there seems to be a strong correlation with humidity and temperature when getting close to the equator.
-
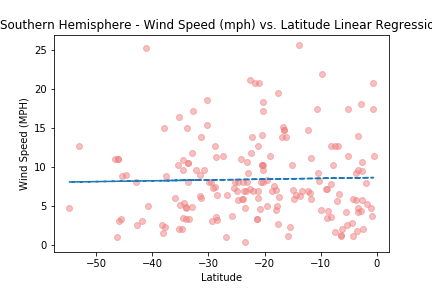
There doesn't seem to be any real correlation with wind speed and latitude, regardless of the hemisphere.
-
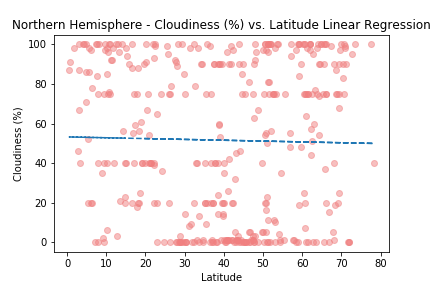
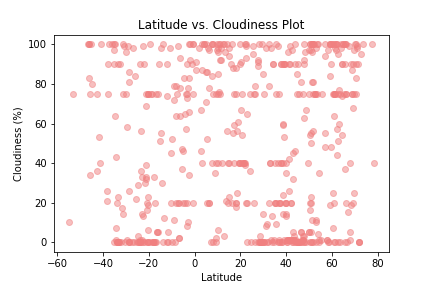
There is a strong correlation with the north and levels of humidity, whether that be humidity that you feel or the overwhelming presence of rain.

