Author: Rodrigo de Alvarenga Mattos
July 16, 2022
The objective of this project is to migrate from an on-premises PostgreSQL database to a managed solution using AWS Redshift cloud data warehouse. The raw data will be stored as JSON logs of user activity, extracted and transformed by the ETL pipeline, and then loaded into a set of dimensional tables. AWS Redshift was a good fit for the project requirements since it's easy to integrate with data lakes, databases, and machine learning tools providing superior performance and scalability to analytics applications and ad-hoc queries.
- Python 3.10
- Boto3 1.24.31
- Redshift Connector 2.0.908
- Psycopg2 2.9.3
- Pandas 1.4.3
- Terraform 1.2.3
- Sphinx 5.0.2
# install project requirements
pip install -r requirements.txtNOTE: Install all python libraries before running the ETL pipeline scripts and the jupyter notebooks.
project
│   README.md
└───src
│   └───etl
│   |   │   create_tables.py
│   |   │   etl.py
|   |   |   sql_queries.py
|   |   |   dwh.cfg
|   |   |   ...
│   └───notebook
│       │   etl.ipynb
│       │   tests.ipynb
└───docs
    └───build
        └───html
            |   index.html
The Sphinx documentation generator was used to build the HTML docs from the source code DOCSTRIGS.
This is the list of services that have been provisioned in the AWS cloud:
| Service | Resource | Description |
|---|---|---|
| IAM | Policy | Provides S3 Full Access. |
| IAM | Role | Redshift service pricipal role. |
| IAM | User | Redshift user permissions statement. |
| S3 | Udacity bucket | Provided by the workspace environment. |
| VPC | Subnet Group and VPN Gateway | Redshift virtual networking environment. |
| VPC | Security Group | Redshift inbound and outbound traffic. |
| Redshift | Multi node cluster | Cloud data warehouse. |
We used Terraform to automate infrastructure provisioning, including servers, network, users, permissions, and security. Please follow the instructions below before running Terraform commands:
- Edit the terraform/secret.tfvars file according to your preferred settings:
redshift_database = "dwh"
redshift_user     = "dwhuser"
redshift_password = "xxxxxxxxxxxxxxxxxxxxxxxx"- Make sure you have the AWS Command Line Interface installed, the user is logged in and the default region is set:
# check the current user
aws iam get-user

# the default region should be set
aws configure get region- Run Terraform commands:
# set terraform folder as working directory
cd terraform

# prepare your working directory
terraform init

# create or update infrastructure
terraform apply -var-file="secret.tfvars"

# destroy previously-created infrastructure
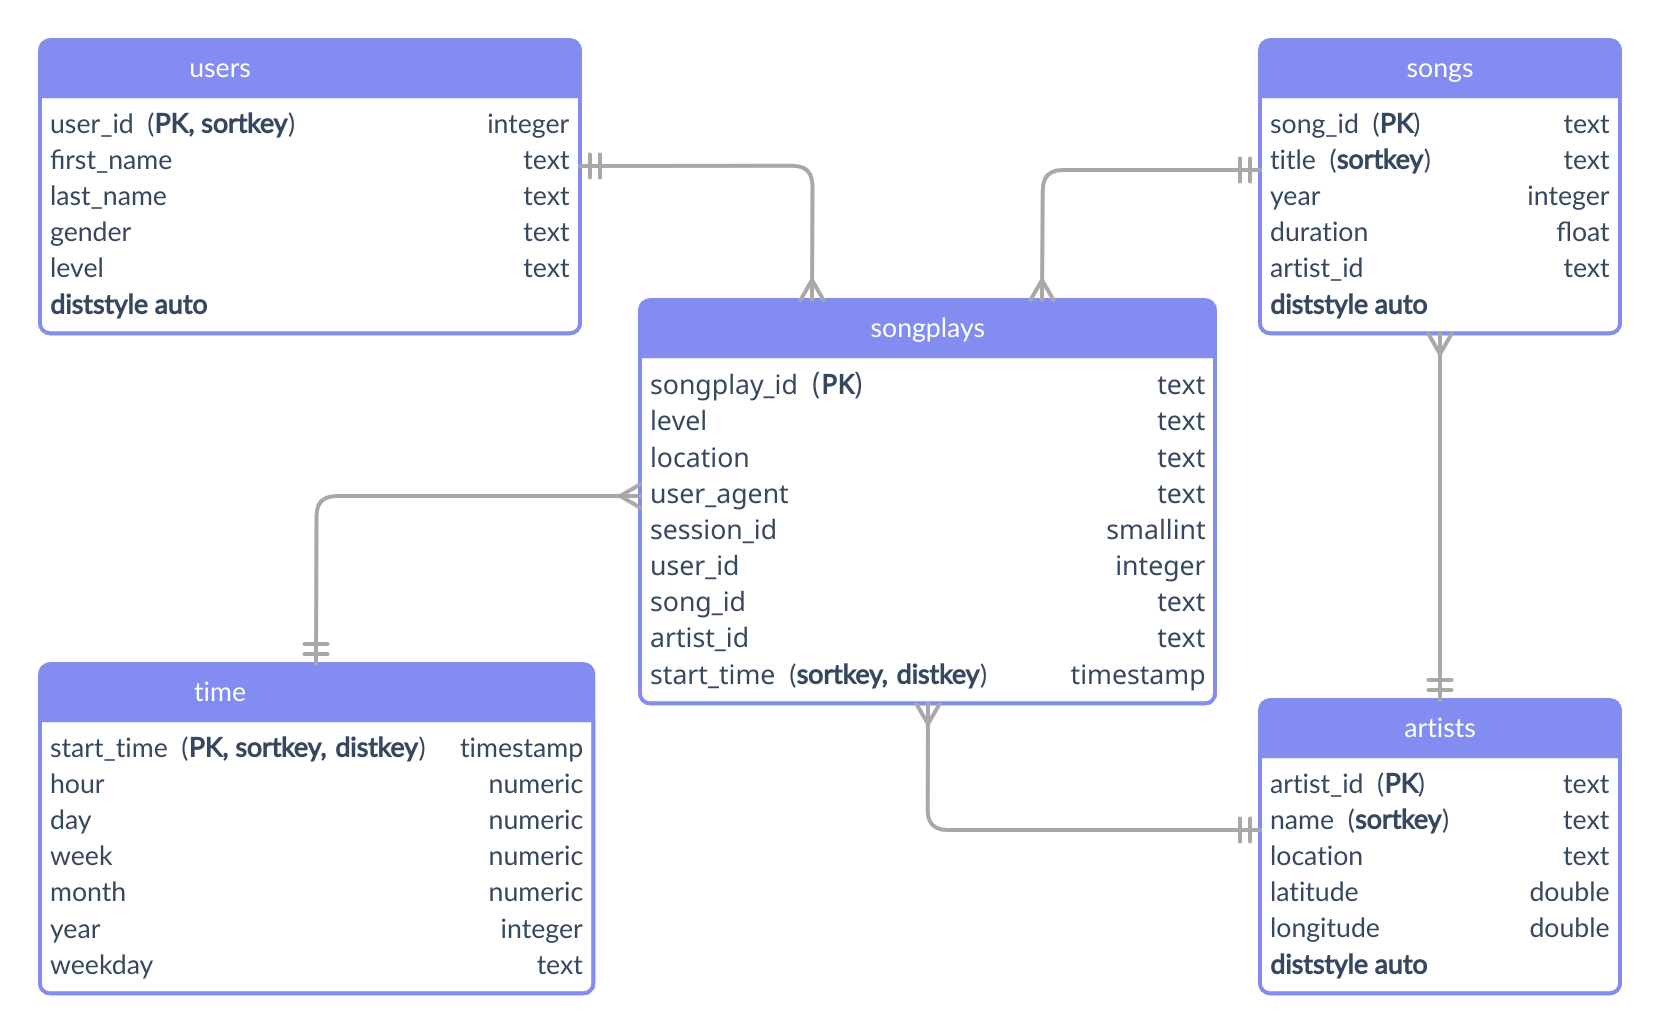
terraform destroy -var-file="secret.tfvars"The database is modeled as a star schema that consists of a fact table (songplays) referencing four dimension tables (artists, songs, time, users).
All the SQL types and tables were defined in the src/etl/sql_queries.py file.
-
Primary Keys - All tables have their unique identifier column set as the primary key.
-
Distribution Style - The fact table (songplays) and the dimension table (time) were defined with the distribution by key (distkey), since the frequency of joins between them tends to be high. Furthermore, both grow on the same scale. Finally, the rest of the tables were set to auto and Redshift chooses the appropriate distribution. Choose the best distribution style.
-
Sort Keys - The fact table (songplays) and the dimension table (time) specify the join column as the sort key. On the other hand, the chosen criteria for the other tables was the column most frequently used to filter equality. Choose the best sort key.
The figure below shows the database structure as an entity relationship diagram:
The sample code below shows the main pipeline of the database creation process in the src/etl/create_tables.py script:
schema = SchemaPipeline(connection)
schema.drop()
schema.create()
IMPORTANT: You should customize the src/etl/dwh.cfg.template configuration file according to your AWS environment and rename it to dwh.cfg.
Run the command below to create the database schema:
# change directory to src
cd src

# to create the schema using the redshift connector
python -m etl.create_tables --redshift

# to create the schema using the pyscopg2 adapter (unstable behavior)
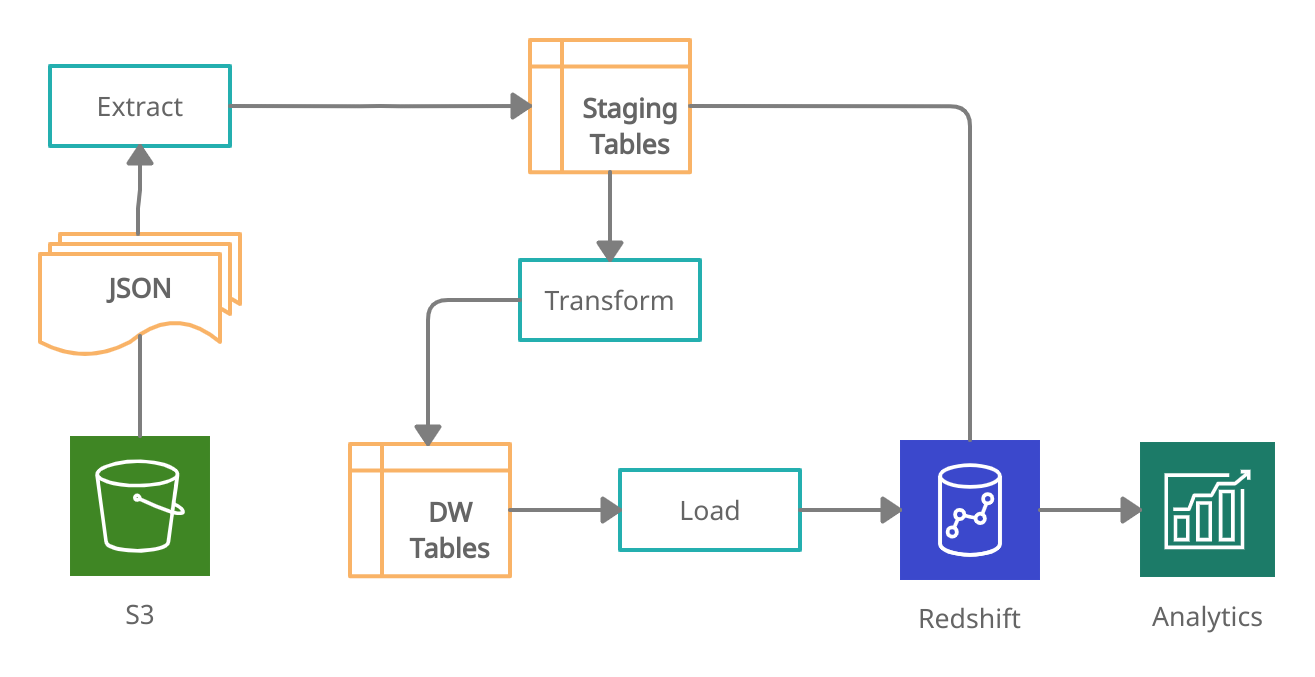
python -m etl.create_tablesThe ETL processes were developed in two phases. The first one implements the Extract Phase and uses the COPY command to transfer raw data from JSON files to the Redshift staging tables. The second one is the Transform and Load Phase and uses the INSERT statement to load data into the star schema tables. Before insertion, the staging table's columns are joined, transformed, and cleaned by the nested SELECT statement.
The figure below shows the ETL Pipeline process diagram.
The sample code below shows the main ETL pipeline process in the src/etl/etl.py script:
pipeline = ETLPipeline(connection)
pipeline.load()
pipeline.insert()
IMPORTANT: You should customize the src/etl/dwh.cfg.template configuration file according to your AWS environment and rename it to dwh.cfg.
Run the command below to execute the ETL pipeline:
# change directory to src
cd src

# to run the pipeline using the redshift connector
python -m etl.etl --redshift

# to run the pipeline using the pyscopg2 adapter (unstable behavior)
python -m etl.etlYou can also run the ETL Pipeline using the jupyter notebook.
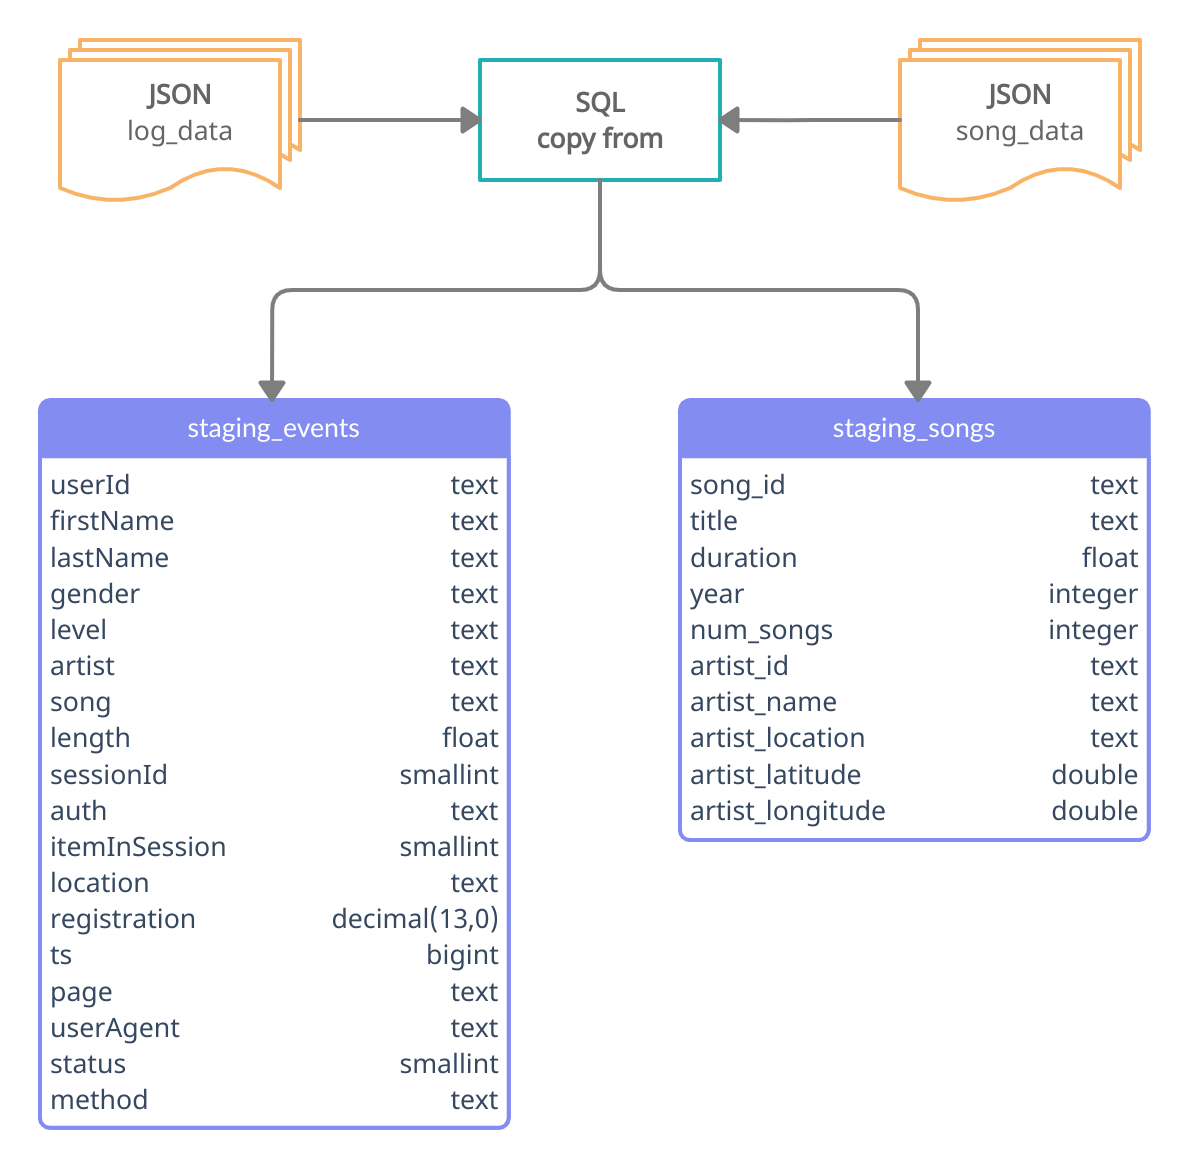
- Song Dataset - The JSON files, located in the directory s3://bucket/song_data, are a subset of the Million Song Dataset and each file contains the following data schema:
{
    "num_songs": 1,
    "artist_id": "ARD7TVE1187B99BFB1",
    "artist_latitude": null,
    "artist_longitude": null,
    "artist_location": "California - LA",
    "artist_name": "Casual",
    "song_id": "SOMZWCG12A8C13C480",
    "title": "I Didn't Mean To",
    "duration": 218.93179,
    "year": 0
}- Log Dataset - The JSON files, located in the directory s3://bucket/log_data, were generated by an event simulator according to the songs data from the previous dataset, and each file contains the following data schema:
{
    "artist":"The Mars Volta",
    "auth":"Logged In",
    "firstName":"Kaylee",
    "gender":"F",
    "itemInSession":5,
    "lastName":"Summers",
    "length":380.42077,
    "level":"free",
    "location":"Phoenix-Mesa-Scottsdale, AZ",
    "method":"PUT",
    "page":"NextSong",
    "registration":1540344794796.0,
    "sessionId":139,
    "song":"Eriatarka",
    "status":200,
    "ts":1541106673796,
    "userAgent":"\"Mozilla\/5.0 (Windows NT 6.1; WOW64) AppleWebKit\/537.36 (KHTML, like Gecko) Chrome\/35.0.1916.153 Safari\/537.36\"",
    "userId":"8"
}The figure below shows the ETL Pipeline's extract phase and the staging tables structure.
The tests notebook defines a sequence of validation tasks that depends on running the ETL pipeline through the ETL notebook first.
At the end of the ETL pipeline execution, a query will be executed for each table, and the result will be stored in a CSV file.
NOTE: Although it is not recommended to query all rows of a table, this decision was made because the service is is too expensive to keep the cluster running indefinitely, and the project tables were small.
Right after the ETL pipeline notebook, you can run the tests notebook to check the following:
| Action | Validation |
|---|---|
| Load all S3 log_data | Compares with the staging table, check row count and nulls |
| Load the staging_events table | Filter page = NextSong and apply a type check lambda function |
| Load S3 log_json_path | Check file content |
| Load S3 song_data sample | Apply a type check lambda function |
| Load the staging_songs table | Join with staging_events to validate redshift's join by row count |
| Load each DW table CSV | Check data inserted into songplays, users, songs, artists and time |
| Summary DataFrame | Compare the number of rows for each table with previous results |


