SSL Certificates
-
SSL Certificates must be created prior to running the cluster, unless you plan on removing SSL settings.
-
See the
README.mdfile within the ssl-broker directory.
Apache Kafka Cluster
-
clusterdirectory -
configuration
- 1 Zookeeper
- 3 Brokers
- 1 Schema Registry
- 1 Rest Proxy
-
User standard docker compose functions to run the cluster. The network is exposed externally to allow for monitoring to be expressed in their own docker compose file.
-
start
docker-compose up -d -
stop & destroy
docker-compose down
-
-
Zookeeper and Brokers are configured to use JMX Prometheus Exporter to extract metrics from the cluster into prometheus.
-
Ports
| hostname | port | localhost port | description |
|---|---|---|---|
| zookeeper | 2181 | 2181 | the zookeepr administration port |
| zookeeper | 2888 | - | inner zookeeper communication |
| zookeeper | 3888 | - | zookeeper leader election |
| broker-1 | 9092 | - | Internal plaintext port for client connection to the broker. |
| broker-1 | 19092 | 19092 | Docker host plaintext port for client connection to the broker. |
| broker-1 | 7071 | 17071 | Prometheus JMX endpoint |
| broker-1 | 7072 | 17072 | Joloika JMX endpoint |
| broker-2 | 9092 | - | Internal plaintext port for client connection to the broker. |
| broker-2 | 29092 | 29092 | Docker host plaintext port for client connection to the broker. |
| broker-2 | 7071 | 27071 | Prometheus JMX endpoint |
| broker-2 | 7072 | 27072 | Joloika JMX endpoint |
| broker-3 | 9092 | - | Internal plaintext port for client connection to the broker. |
| broker-3 | 39092 | 39092 | Docker host plaintext port for client connection to the broker. |
| broker-3 | 7071 | 37071 | Prometheus JMX endpoint |
| broker-3 | 7072 | 37072 | Joloika JMX endpoint |
| broker-4 | 9092 | - | Internal plaintext port for client connection to the broker. |
| broker-4 | 49092 | 49092 | Docker host plaintext port for client connection to the broker. |
| broker-4 | 7071 | 47071 | Prometheus JMX endpoint |
| broker-4 | 7072 | 47072 | Joloika JMX endpoint |
| schema-registry | 8081 | 8081 | standard point for accessing and registing Avro schemas |
Monitoring
-
monitoringdirectory -
configuration
- prometheus
- grafana
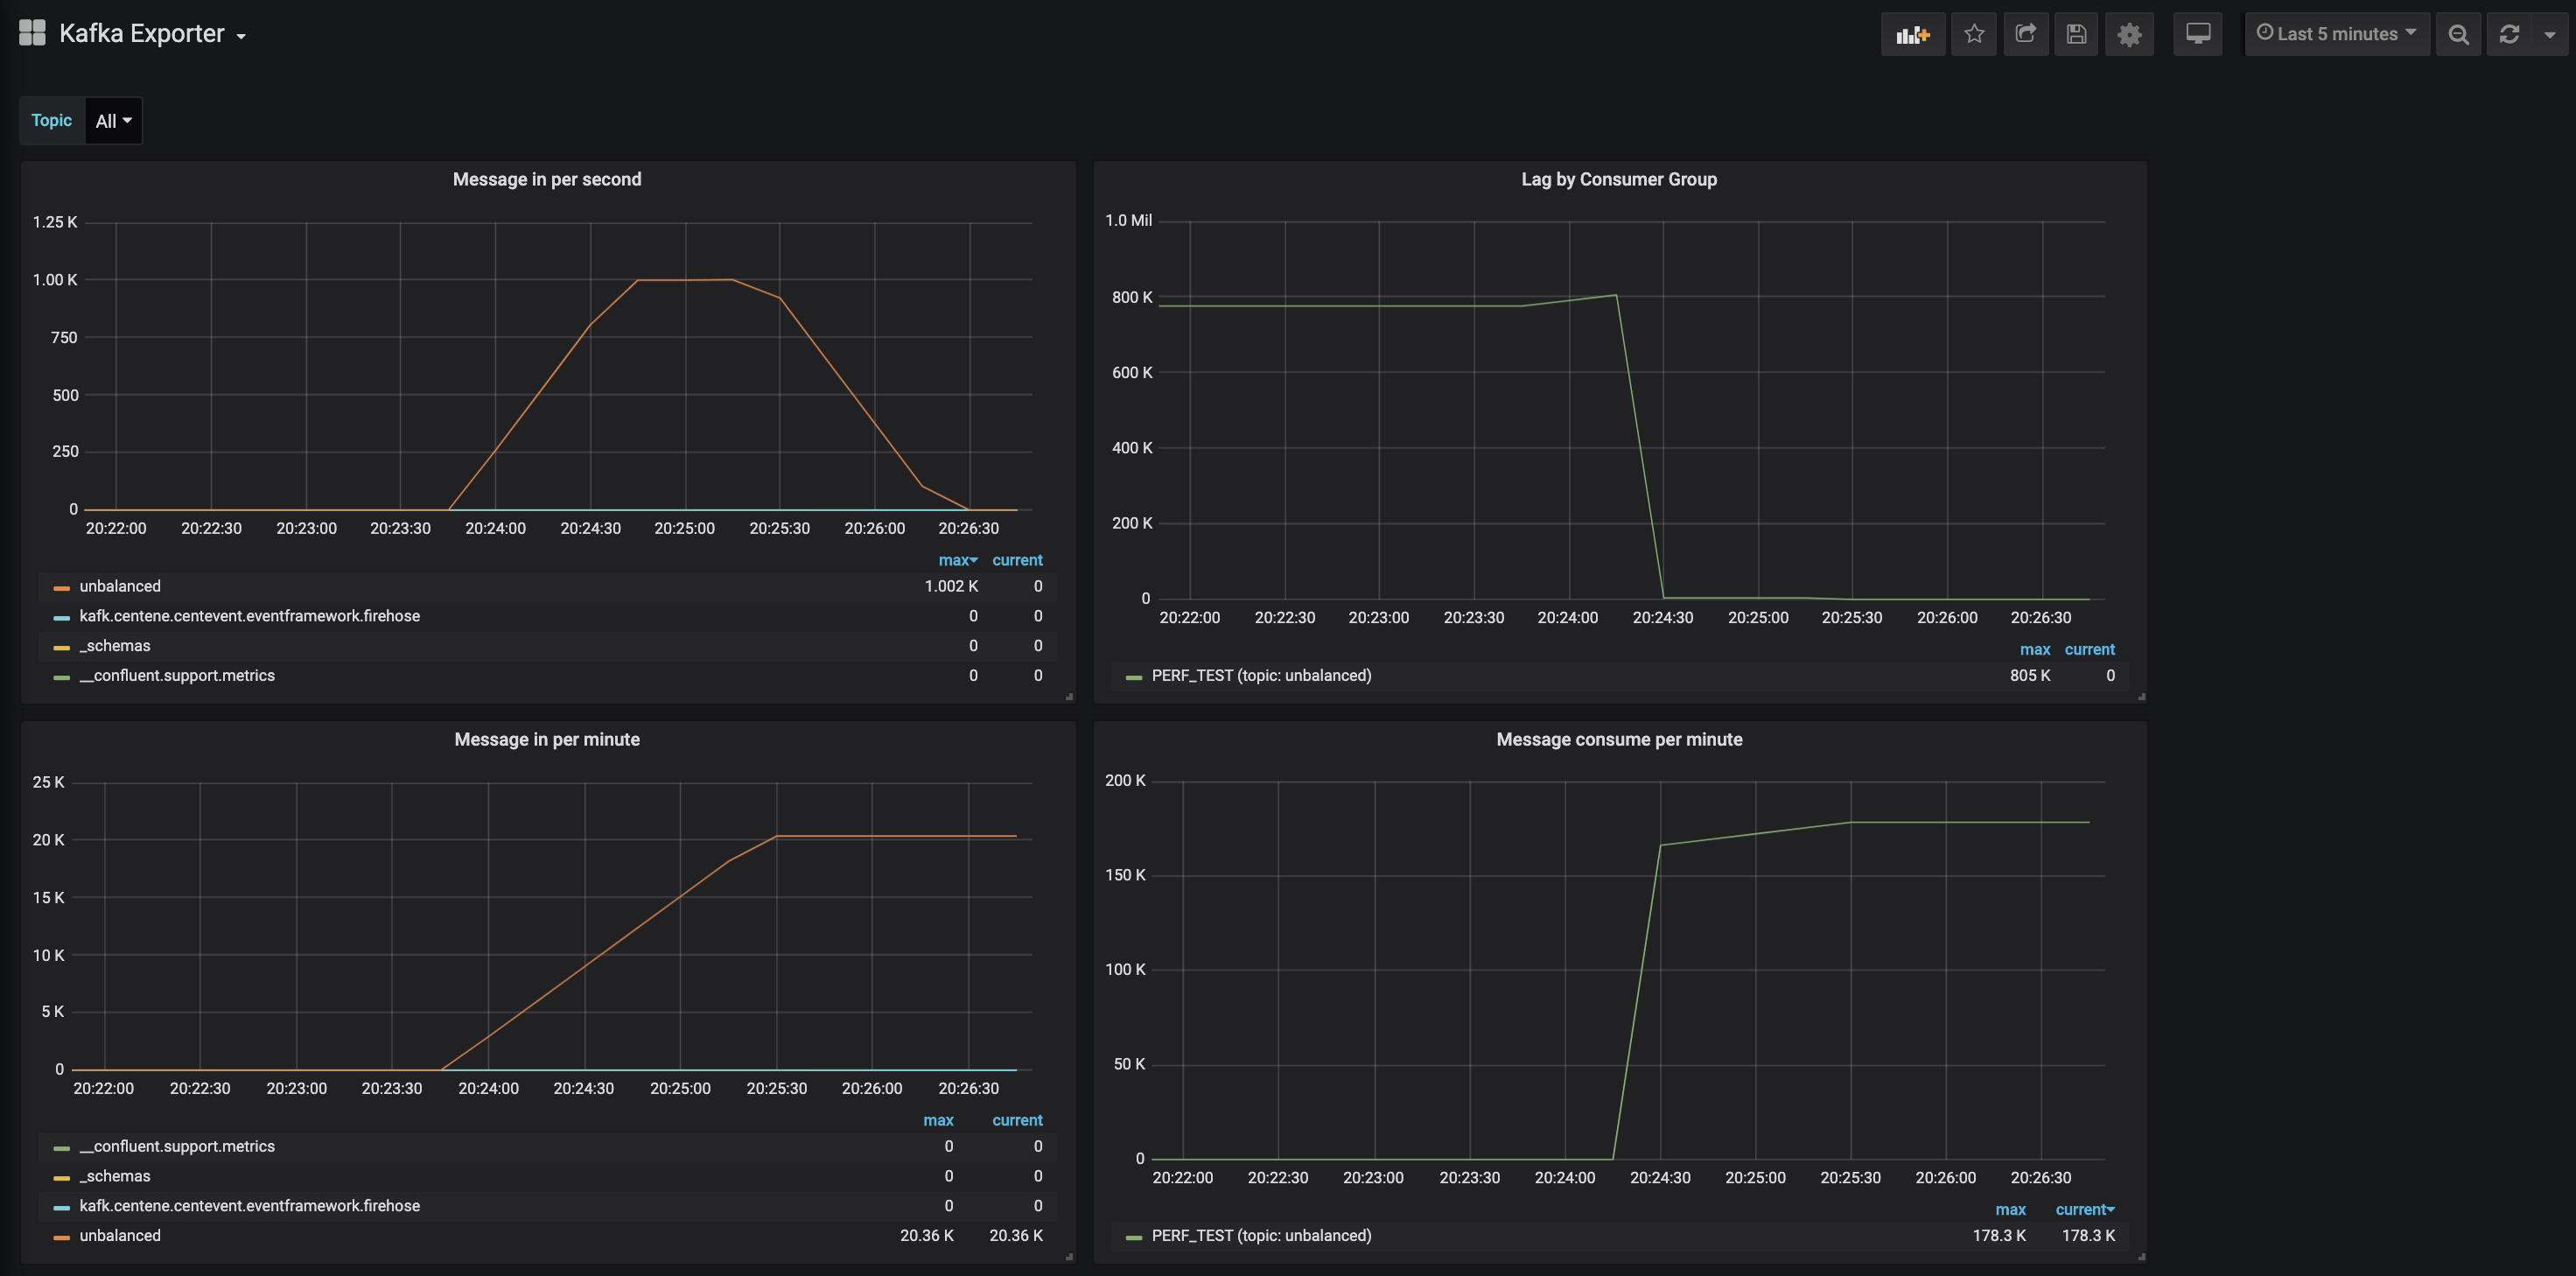
- kafka exporter
- kafkahq
- KafkaHQ provides access to the cluster via SSL, copy the truststore from the cluster
into the monitoring directory
monitoring/certs/kafka.truststore.jks. If you change the broker password, you will need to change it in thekafkahq.ymlfile as well.
- KafkaHQ provides access to the cluster via SSL, copy the truststore from the cluster
into the monitoring directory
-
Grafana
-
Administration Credentials
- Username:
admin - Password:
grafana
- Username:
-
Dashboards
-
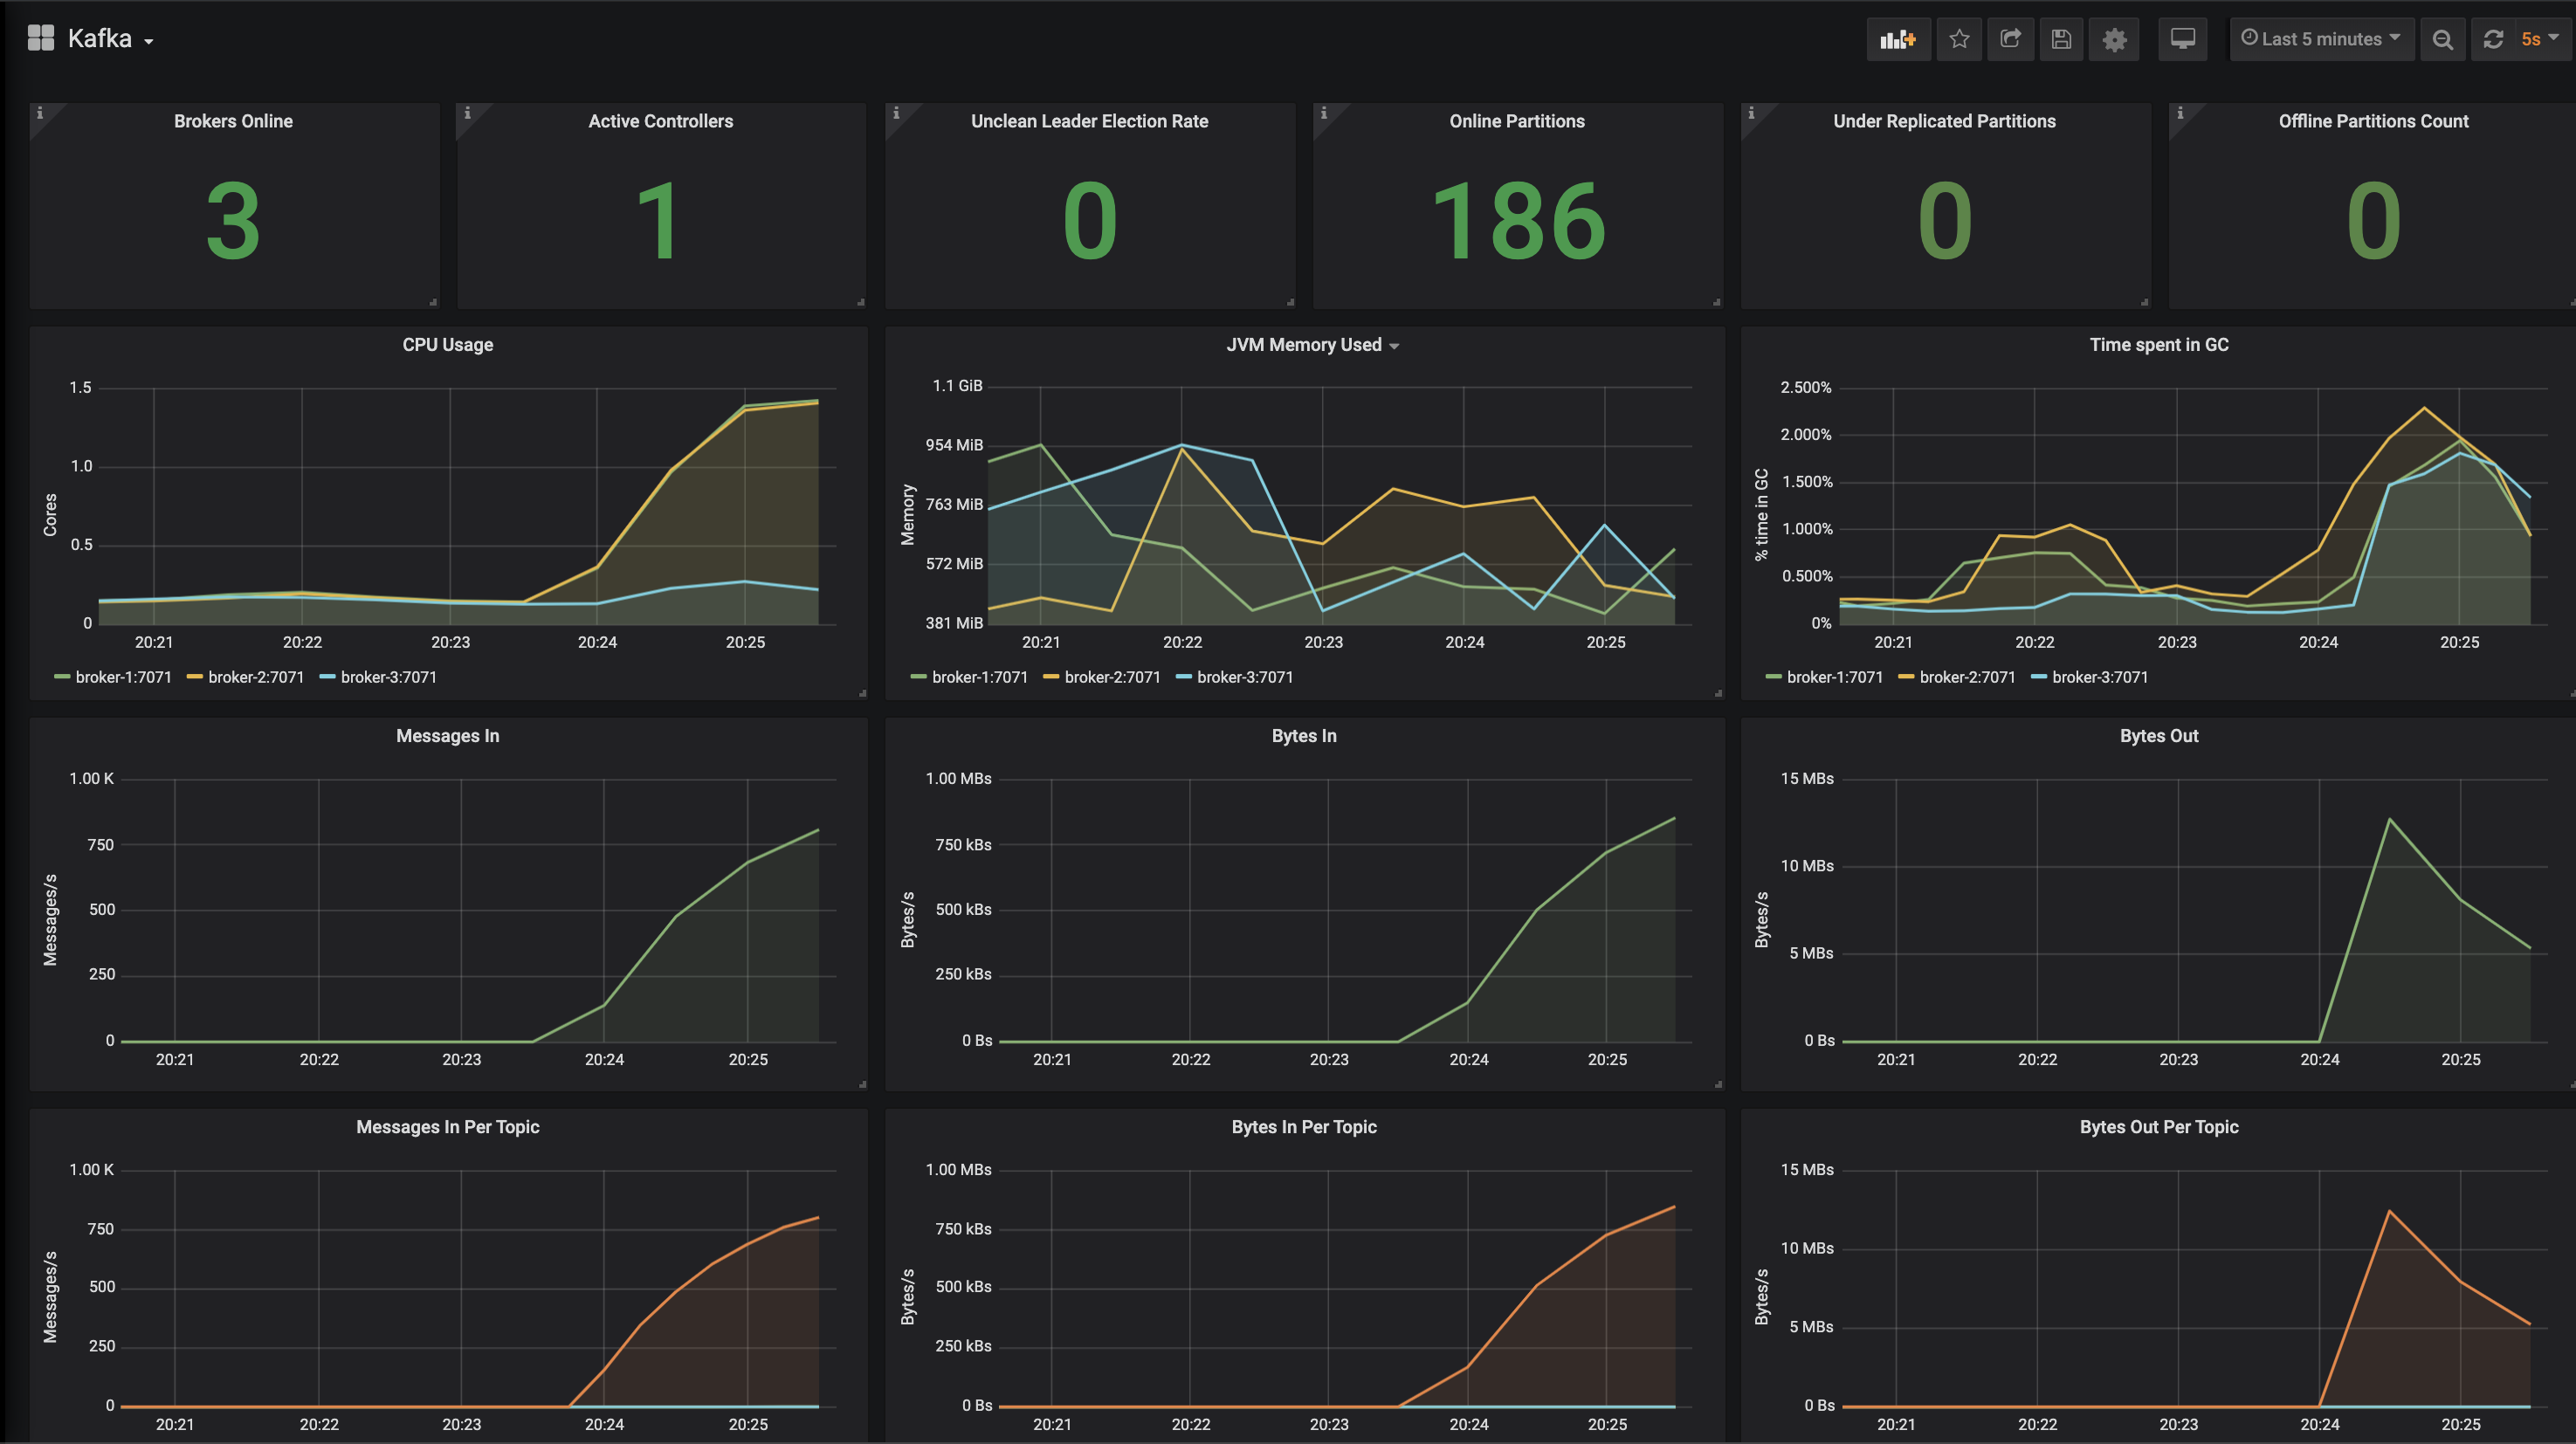
Kafka - Standard Health of the cluster
-
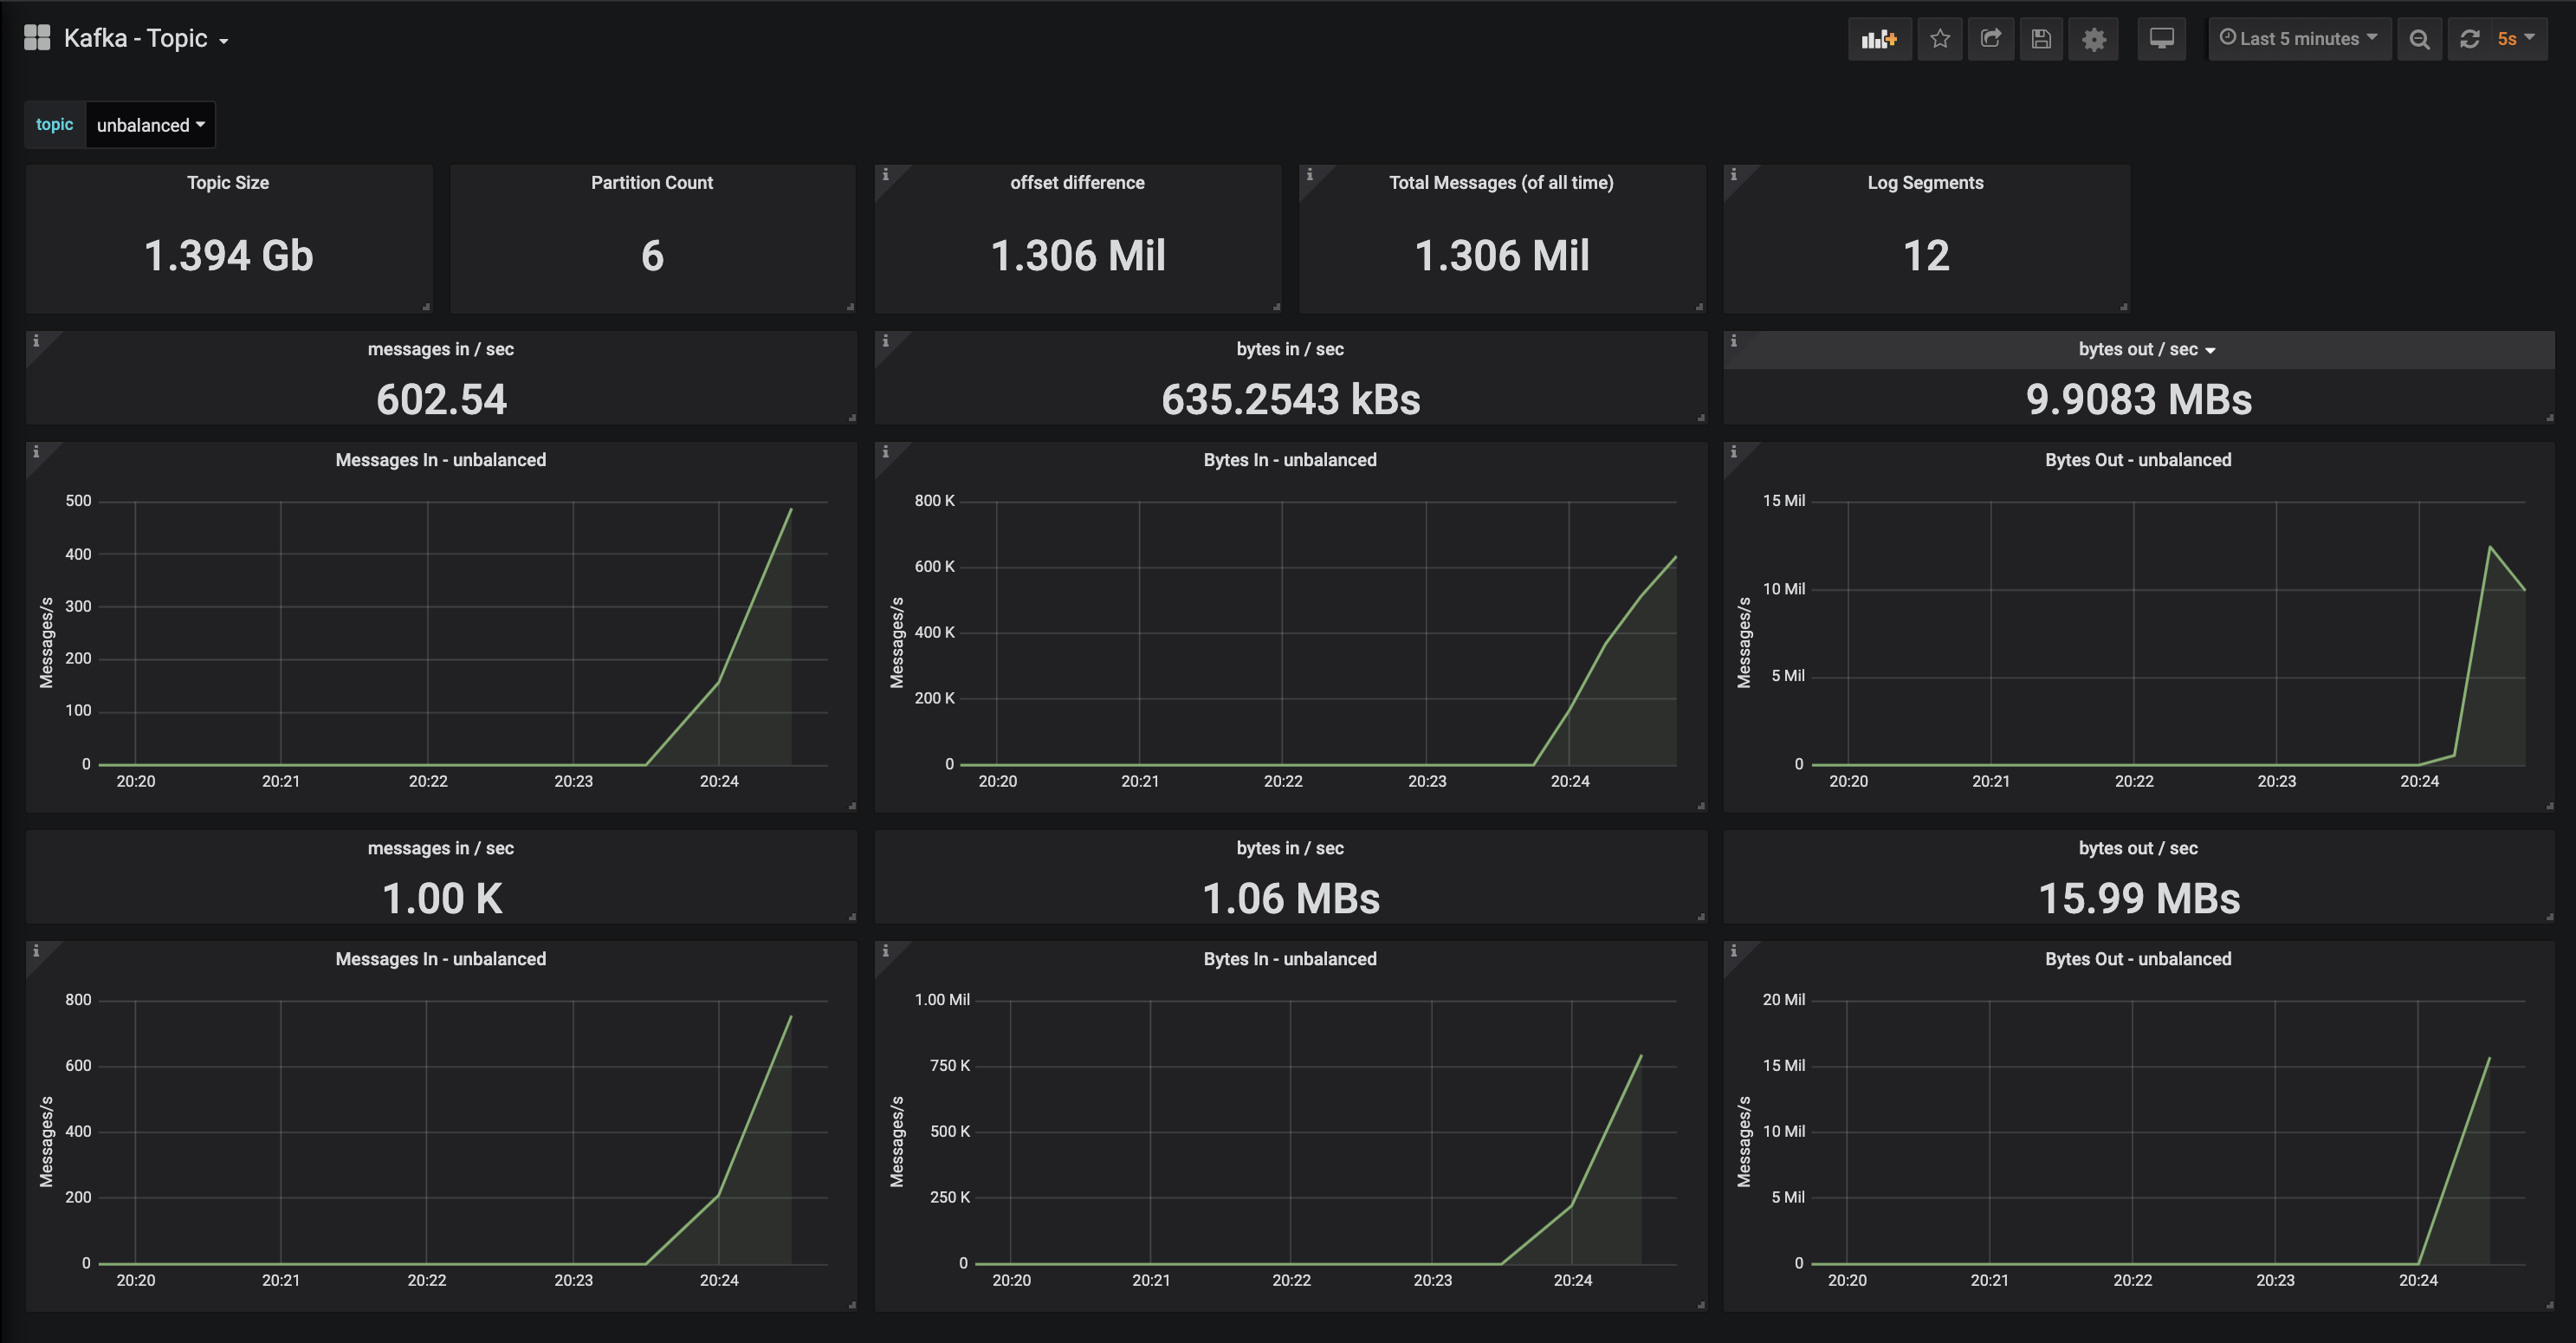
Kafka Topic - provides metrics for the selected topic
** Row 1 - Message In / Bytes In / Bytes Out, Kafka Rate averages.
** Row 2 - Message In / Bytes In / Bytes Out, Kafka totals, and Grafana does the averaging.
-
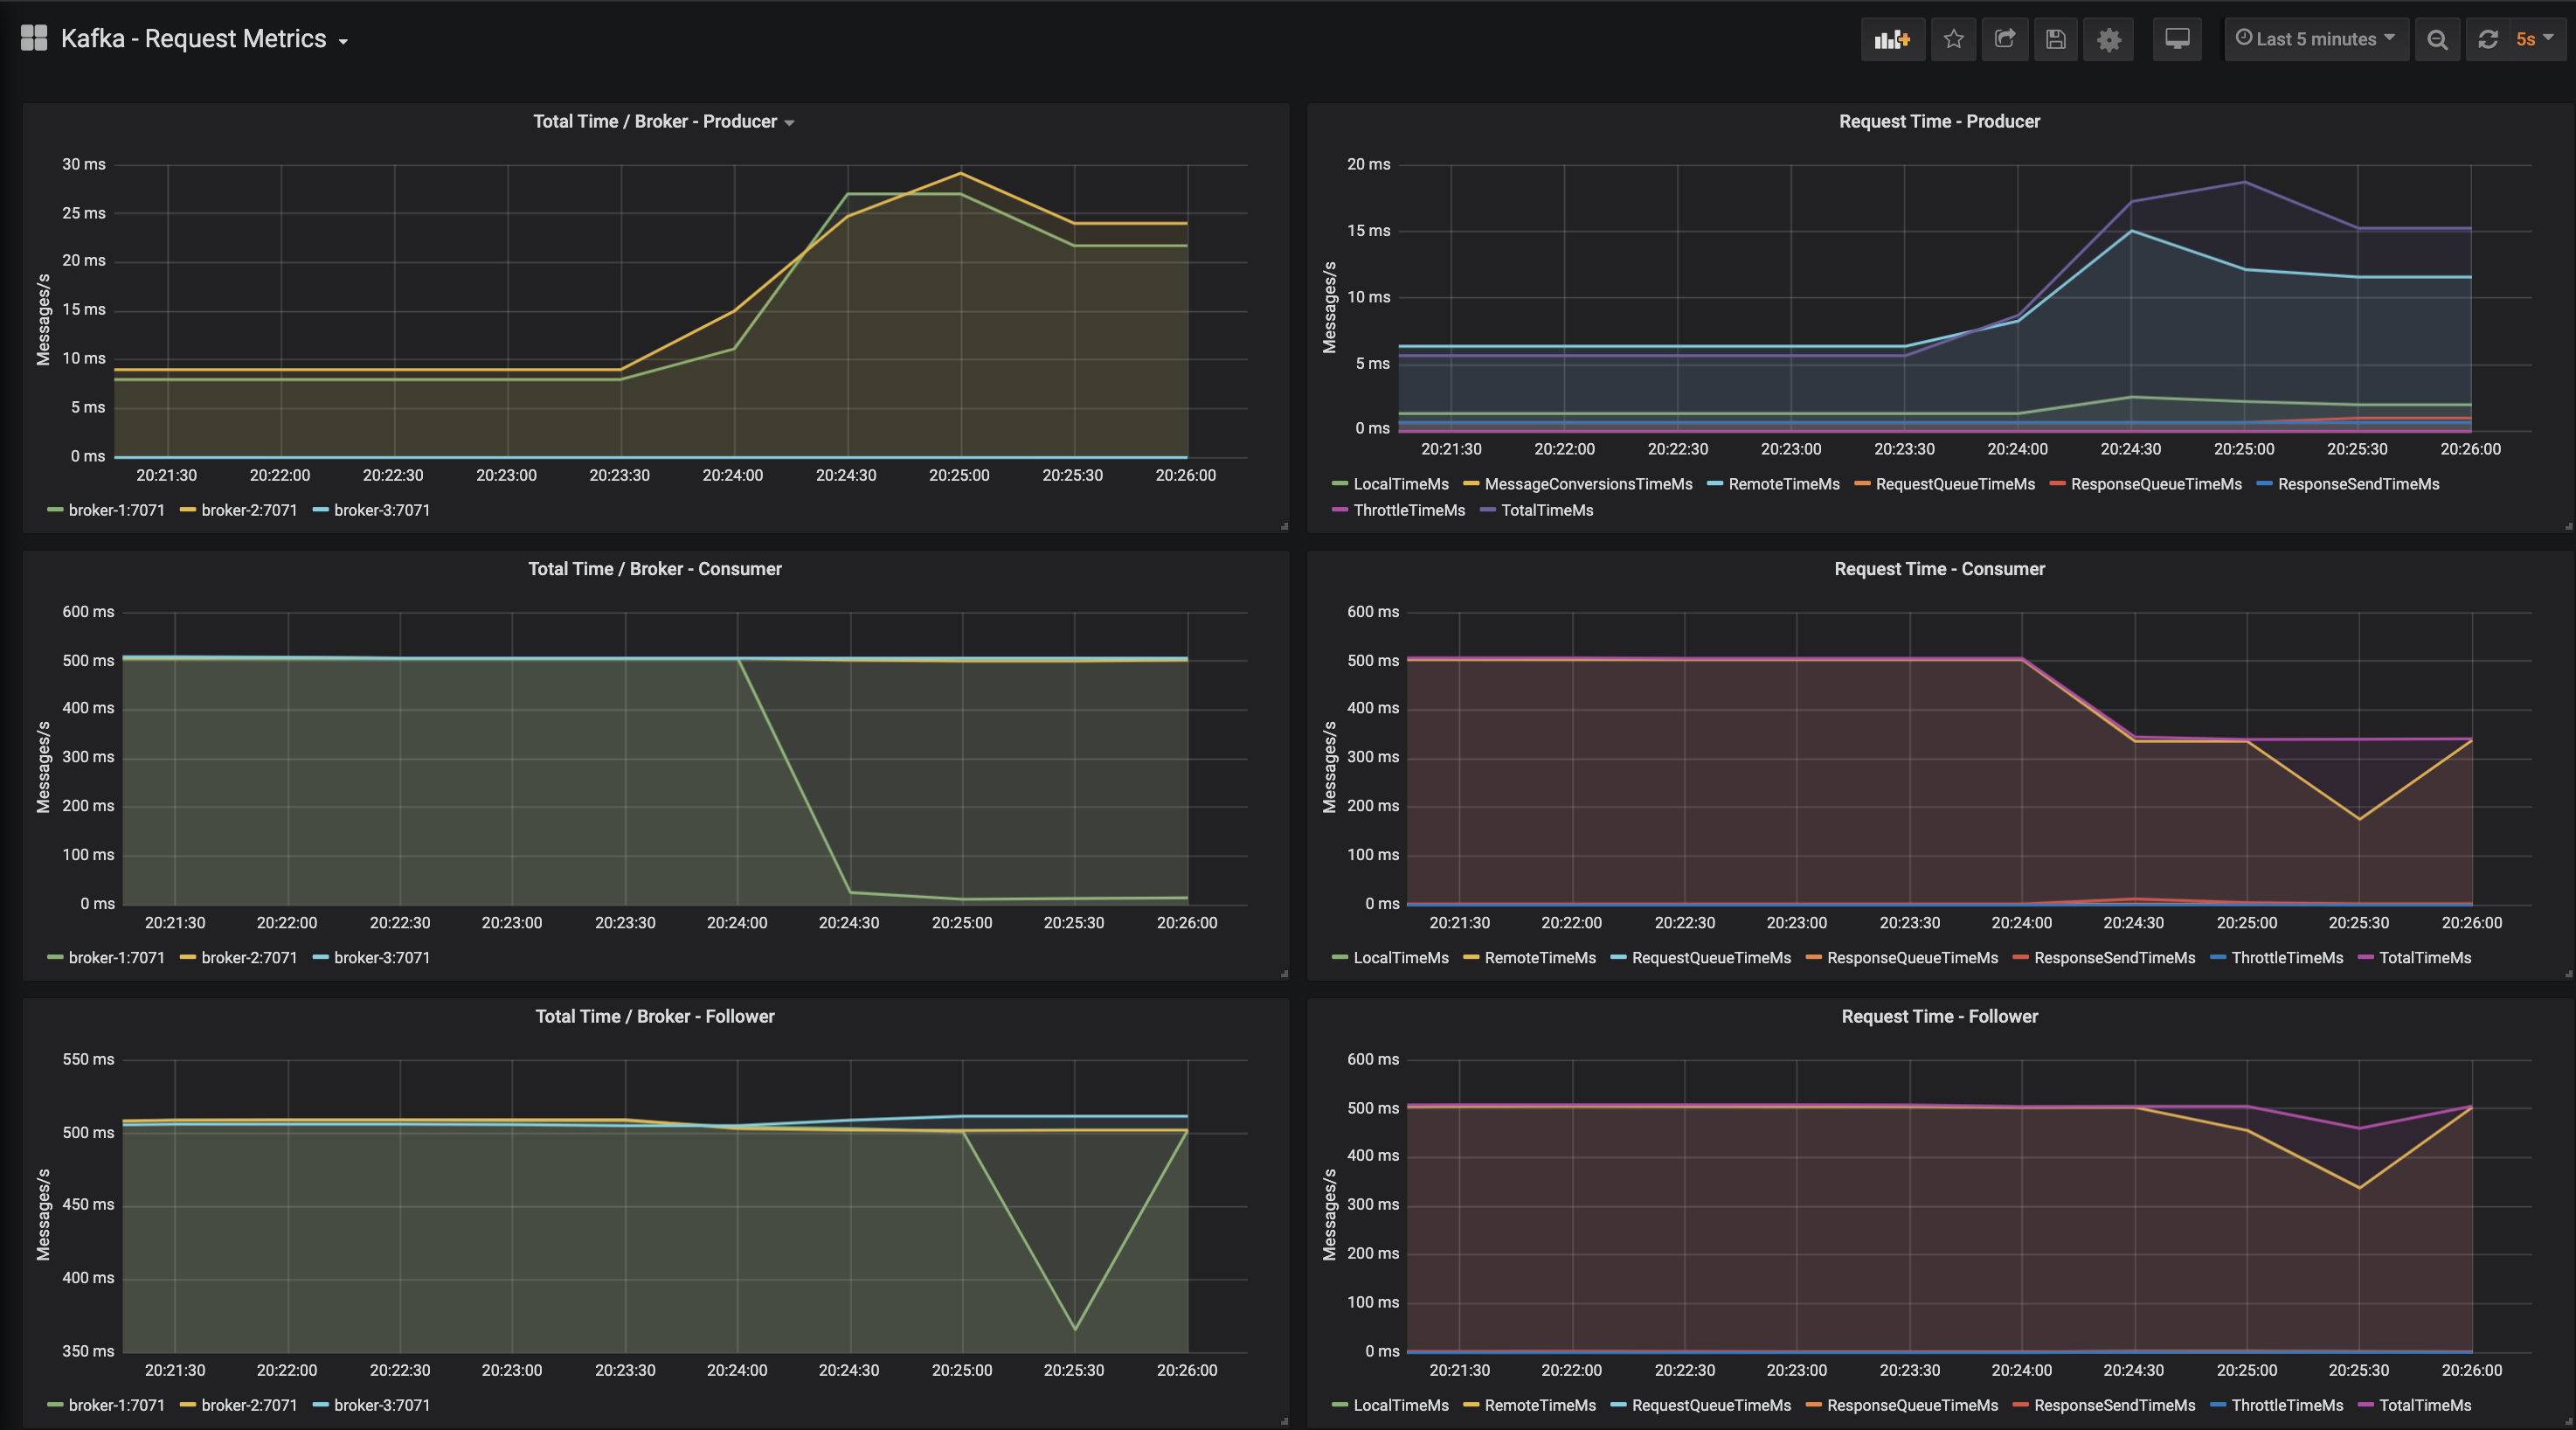
Kafka Request Metrics - showcases the JMX Metrics around client response times
-
-
-
KafkaHQ
-
Administration Credentials
- Username:
admin - Password:
kafkahq
- Username:
-
Bin
- commands to help administrate your cluster. It assumes the confluent community source or confluent enterprise installation is on your MacOS or Linux environment.
Scripts
- scripts used to test your cluster. This includes performance scripts and additional support.


