This is a simple backend application that fetches abuse IP threat score, finds out their geographical information and format to be displayed on a map through rest endpoints.
It publishes a restful API, which can be used for displaying information in, such as on a map, and then further sort & paged etc. It also provides rich endpoints to search for information.
The application works in three phases. First, it fetches blacklisted IPs with associated abuse scores from a third-party service called: abuseipdb.com. The website has constraints on how many requests one particular user can make at a time. So we figured to use a corn job to run it periodically so that it doesn't hit too many requests.
Once a request is processed through a scheduled job, it then finds the geolocation based on the IP address using a local geolocation database. The database is available on maxmind.com. Then the information is stored in a local SQL database.
Finally, the information is then exposed through a rest endpoint so that the application user consumes it. The APIs are protected, thus authentication is required.
When it comes to design decisions, simplicity and conventional use took precedence over complexity without speculating on future work. Also, the scope of the project is limited and we had a time constraint. If are given a larger scope and sufficient time, we might consider things differently. For example, for the cache, we have just used the default cache provider of spring. In future, sure we can consider something more performant, such as Redis etc.
For security, spring security is a well-known one and easy to use, so we decided to go ahead with it. For database, we perhaps don't need a relational database for this application, a NoSQL one is more appropriate since we don't have much relation between various sets of data. The data from various sources ( vulnerability database) could very well be unstructured or semi-structured. so NoSql certainly does make sense here. Again, for simplicity, we used SQL here, it is just easy to use, and spring data made it super useful.
There is plenty of room for further improvements which you eventually can do gradually as you progress.
- Java 17
- Spring Boot 2.5.6
- Spring Data
- Spring Security
- JWT
- Spring Cache
- Lombok
- JUnit 5
- Mockito
- Swagger Docs
- Gradle
- GitHub Action (CI/CD)
- SonarQube (Static Analysis)
- Java 17 This project is written on java 17. Download the latest version of java from: https://adoptium.net/
git clone https://github.com/rokon12/threat-visualizer-api.git
The project can easily be setup on intelliJ IDEA. File > Open and then find out the build.gradle file from the project directory and then select Open as Project
That's it.
To run the project, you just have find out the main class which is ThreatVisualizedApplication from the IDE and run the main method using the IDE.
On the other hand, we can run it using Gradle as well. From the command line go to the project root directory and run the following command-
./gradlwe clean bootRun
Once the application starts, we can hit the browser to the following link:
http://localhost:8080/
This page will bring a welcome page where we will find the link to the swagger api Docs.
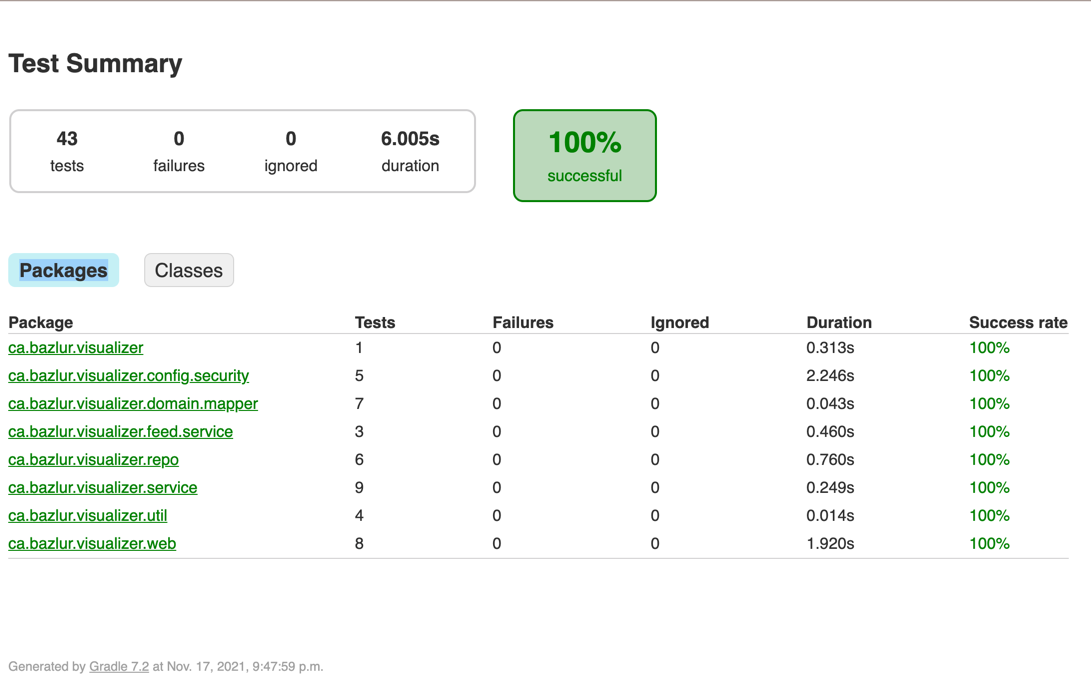
We have both unit test and integration test suites in the repo and both of them run with JUnit 5 and Mockito on top of the testing functionality spring boot provides. The following command will run the test cases with coverage:
./gradlew testCoverageWe can then checkout the coverage from the build/reports/jacoco/test/html directory.

Note: The configuration classes are excluded from test coverage.
We can enable the job and configure jobs using the following key-value from the application.properties
abuse.confidence.score.fetch.jobs.enabled = false
abuse.confidence.score.fetch.jobs.cron =0 0 0/6 1/1 * ?
Besides these, we can configure a range of other things, e.q a database. The project is built on top of a file-based h2 database. But we can always change it MySQL or any other Relational Database.
## H2 database
spring.datasource.url=jdbc:h2:file:./h2db/local_db
spring.datasource.driverClassName=org.h2.Driver
spring.datasource.username=sa
spring.datasource.password=password
spring.jpa.database-platform=org.hibernate.dialect.H2Dialect

# Hibernate config
spring.jpa.generate-ddl=true
spring.jpa.hibernate.ddl-auto = update
spring.jpa.show-sql=true
spring.jpa.properties.hibernate.format_sql=falseOn each commit pull request to master, the CI/CD pipeline runs through GitHub Action. It runs the tests, does the code coverage checking and creates a badge, so the sonarqube analysis and then build the project.
The first thing is to register a user to the application, which we can do hitting following api
curl -X 'POST' \
  'http://127.0.0.1:8080/api/v1/public/register' \
  -H 'accept: application/json' \
  -H 'Content-Type: application/json' \
  -d '{
  "username": "username@example.com",
  "fullName": "The Full name",
  "password": "Test12345_",
  "rePassword": "Test12345_"
}'
The API does input validation and if everything goes well, it will return 200 OK with following response-
{
  "id": 3,
  "username": "username@example.com",
  "fullName": "The Full name"
}The next steps is to Log In with the username and password that we just registered with.
curl -X 'POST' \
  'http://127.0.0.1:8080/api/v1/public/login' \
  -H 'accept: application/json' \
  -H 'Content-Type: application/json' \
  -d '{
  "username": "username@example.com",
  "password": "Test12345_"
}'
The response -
{
  "username": "bazlur@bazlur.ca",
  "token": "eyJhbGciOiJIUzUxMiJ9.eyJzdWIiOiIyLGJhemx1ckBiYXpsdXIuY2EiLCJpc3MiOiJiYXpsdXIuY2EiLCJpYXQiOjE2MzcyMDAxMDIsImV4cCI6MTYzNzgwNDkwMn0.x2-2WsumsbUlXmCpJz5A2B-RxWZ318rUzSThT6iu_jvgfUT9YG_CMG3JS50A1mxQGiT15z9bBLh1kBMwJP166g"
}
From this response, we are primarily interested in the token. This is a JWT token that we need to pass on subsequent rest calls for the rest of the API.
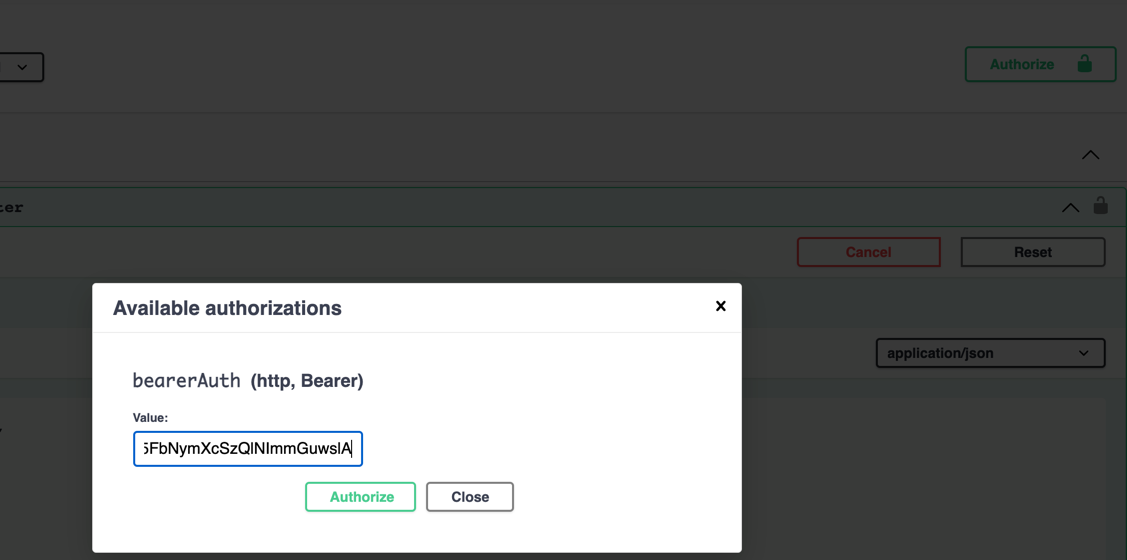
We can authorize the Swagger with this token so that the next api call adds this automatically.
curl -X 'GET' \
  'http://127.0.0.1:8080/api/v1/abuse-confidence-score?page=0&size=5&sortBy=country%2Casc' \
  -H 'accept: application/json' \
  -H 'Authorization: Bearer eyJhbGciOiJIUzUxMiJ9.eyJzdWIiOiIzLHVzZXJuYW1lQGV4YW1wbGUuY29tIiwiaXNzIjoiYmF6bHVyLmNhIiwiaWF0IjoxNjM3MTYzMjkzLCJleHAiOjE2Mzc3NjgwOTN9.tyFwvxL4wXHsIRr6hcexm6L4_FxSscPN7nW6P1NtGO5rV7U29lgsDKb4GXlEU1aU5FbNymXcSzQlNImmGuwslA'
And the response -
{
  "type": "FeatureCollection",
  "features": [
    {
      "type": "Feature",
      "geometry": {
        "coordinates": [
          18.4968,
          -12.4992
        ],
        "type": "Point"
      },
      "properties": {
        "country": "Angola",
        "score": 100.0,
        "city": null,
        "ip": "41.72.61.67",
        "lastReportedAt": "2021-11-15T17:23:21-05:00"
      }
    },
    {
      "type": "Feature",
      "geometry": {
        "coordinates": [
          -58.3845,
          -34.6022
        ],
        "type": "Point"
      },
      "properties": {
        "country": "Argentina",
        "score": 100.0,
        "city": null,
        "ip": "200.73.128.148",
        "lastReportedAt": "2021-11-15T20:14:30-05:00"
      }
    },
    {
      "type": "Feature",
      "geometry": {
        "coordinates": [
          -60.6634,
          -32.954
        ],
        "type": "Point"
      },
      "properties": {
        "country": "Argentina",
        "score": 100.0,
        "city": "Rosario",
        "ip": "181.117.202.166",
        "lastReportedAt": "2021-11-15T19:47:37-05:00"
      }
    },
    {
      "type": "Feature",
      "geometry": {
        "coordinates": [
          -60.0366,
          -34.9039
        ],
        "type": "Point"
      },
      "properties": {
        "country": "Argentina",
        "score": 100.0,
        "city": "Chivilcoy",
        "ip": "186.33.235.81",
        "lastReportedAt": "2021-11-15T19:39:21-05:00"
      }
    },
    {
      "type": "Feature",
      "geometry": {
        "coordinates": [
          -58.3845,
          -34.6022
        ],
        "type": "Point"
      },
      "properties": {
        "country": "Argentina",
        "score": 100.0,
        "city": null,
        "ip": "190.221.151.226",
        "lastReportedAt": "2021-11-15T20:14:15-05:00"
      }
    },
    {
      "type": "Feature",
      "geometry": {
        "coordinates": [
          -58.3845,
          -34.6022
        ],
        "type": "Point"
      },
      "properties": {
        "country": "Argentina",
        "score": 100.0,
        "city": null,
        "ip": "200.73.138.136",
        "lastReportedAt": "2021-11-15T20:15:23-05:00"
      }
    },
    {
      "type": "Feature",
      "geometry": {
        "coordinates": [
          -64.1848,
          -31.3918
        ],
        "type": "Point"
      },
      "properties": {
        "country": "Argentina",
        "score": 100.0,
        "city": "Córdoba",
        "ip": "190.96.112.84",
        "lastReportedAt": "2021-11-15T20:00:59-05:00"
      }
    },
    {
      "type": "Feature",
      "geometry": {
        "coordinates": [
          -64.1848,
          -31.3918
        ],
        "type": "Point"
      },
      "properties": {
        "country": "Argentina",
        "score": 100.0,
        "city": "Córdoba",
        "ip": "200.32.84.12",
        "lastReportedAt": "2021-11-15T19:24:04-05:00"
      }
    },
    {
      "type": "Feature",
      "geometry": {
        "coordinates": [
          -65.3417,
          -26.7444
        ],
        "type": "Point"
      },
      "properties": {
        "country": "Argentina",
        "score": 100.0,
        "city": "Yerba Buena",
        "ip": "201.253.99.210",
        "lastReportedAt": "2021-11-15T19:42:40-05:00"
      }
    },
    {
      "type": "Feature",
      "geometry": {
        "coordinates": [
          -58.4455,
          -34.6049
        ],
        "type": "Point"
      },
      "properties": {
        "country": "Argentina",
        "score": 100.0,
        "city": "Buenos Aires",
        "ip": "190.210.166.140",
        "lastReportedAt": "2021-11-15T17:59:13-05:00"
      }
    }
  ]
}
The response are formatted with GeoJson,1 specification.
We can view this response in : https://geojson.io/
Request -
curl -X 'POST' \
  'http://127.0.0.1:8080/api/v1/abuse-confidence-score/search' \
  -H 'accept: application/json' \
  -H 'Authorization: Bearer eyJhbGciOiJIUzUxMiJ9.eyJzdWIiOiIzLHVzZXJuYW1lQGV4YW1wbGUuY29tIiwiaXNzIjoiYmF6bHVyLmNhIiwiaWF0IjoxNjM3MTYzMjkzLCJleHAiOjE2Mzc3NjgwOTN9.tyFwvxL4wXHsIRr6hcexm6L4_FxSscPN7nW6P1NtGO5rV7U29lgsDKb4GXlEU1aU5FbNymXcSzQlNImmGuwslA' \
  -H 'Content-Type: application/json' \
  -d '{
  "page": 0,
  "size": 10,
  "query": {
    "country": "France"
  },
  "sortBy": "city"
}'
It can further filer, sort by field for example, city, ip etc .


