Structuring of Complex Longitudinal Data into Long Format
Authors: Romain Neugebauer, Noel Pimentel, and Nima Hejazi
The goal of LtAtStructuR is to structure a collection of time-stamped
measurements (e.g., electronic health record data) into a standard long
format analytic dataset suitable for the evaluation of the effect of
multiple time-point interventions in the presence of time-dependent
confounding or sources of selection bias.
Download the LtAtStructuR directory and install the package from the
command line using
R CMD INSTALL LtAtStructuRor from within R using the package tarball (.tar.gz) with
install.packages("PATH/TO/LtAtStructuR_version.tar.gz", type = "local")where the path to the package tarball and version number must be
amended. A tarball may be generated by invoking Rscript -e "devtools::build()" from the root directory of this project.
How to use the package? (Description of input/output)
What data coarsening algorithms are implemented by the package?
This is a basic example which shows how to structure longitudinal data with an interval exposure:
library(LtAtStructuR)
library(data.table)
library(lubridate)
library(future) # optional (for parallel processing)
plan(multiprocess) # optional (for parallel processing)

## Define one cohort dataset, one exposure dataset, and one or more covariate
## datasets
cohort <- setCohort(cohortDT, "ID", "IndexDate", "EOFDate", "EOFtype",
                    "AMI", c("ageEntry", "sex", "race", "A1c", "eGFR"),
                    list("ageEntry"=list("categorical"=FALSE,
                                        "impute"=NA,
                                        "impute_default_level"=NA),
                        "sex"=list("categorical"=TRUE,
                                   "impute"=NA,
                                   "impute_default_level"=NA),
                        "race"=list("categorical"=TRUE,
                                    "impute"=NA,
                                    "impute_default_level"=NA)) )
exposure <- setExposure(expDT, "ID", "startA", "endA")
covariate1 <- setCovariate(a1cDT, "sporadic", "ID", "A1cDate", "A1c",
                           categorical = FALSE)
covariate2 <- setCovariate(egfrDT, "sporadic", "ID", "eGFRDate", "eGFR",
                           categorical = TRUE)

## Gather each input dataset into a single object that specifies the content of
## the output dataset to be constructed
LtAt.specification <- cohort + exposure + covariate1 + covariate2

## Construct the output dataset
LtAt.data <- construct(LtAt.specification, time_unit = 15, first_exp_rule = 1,
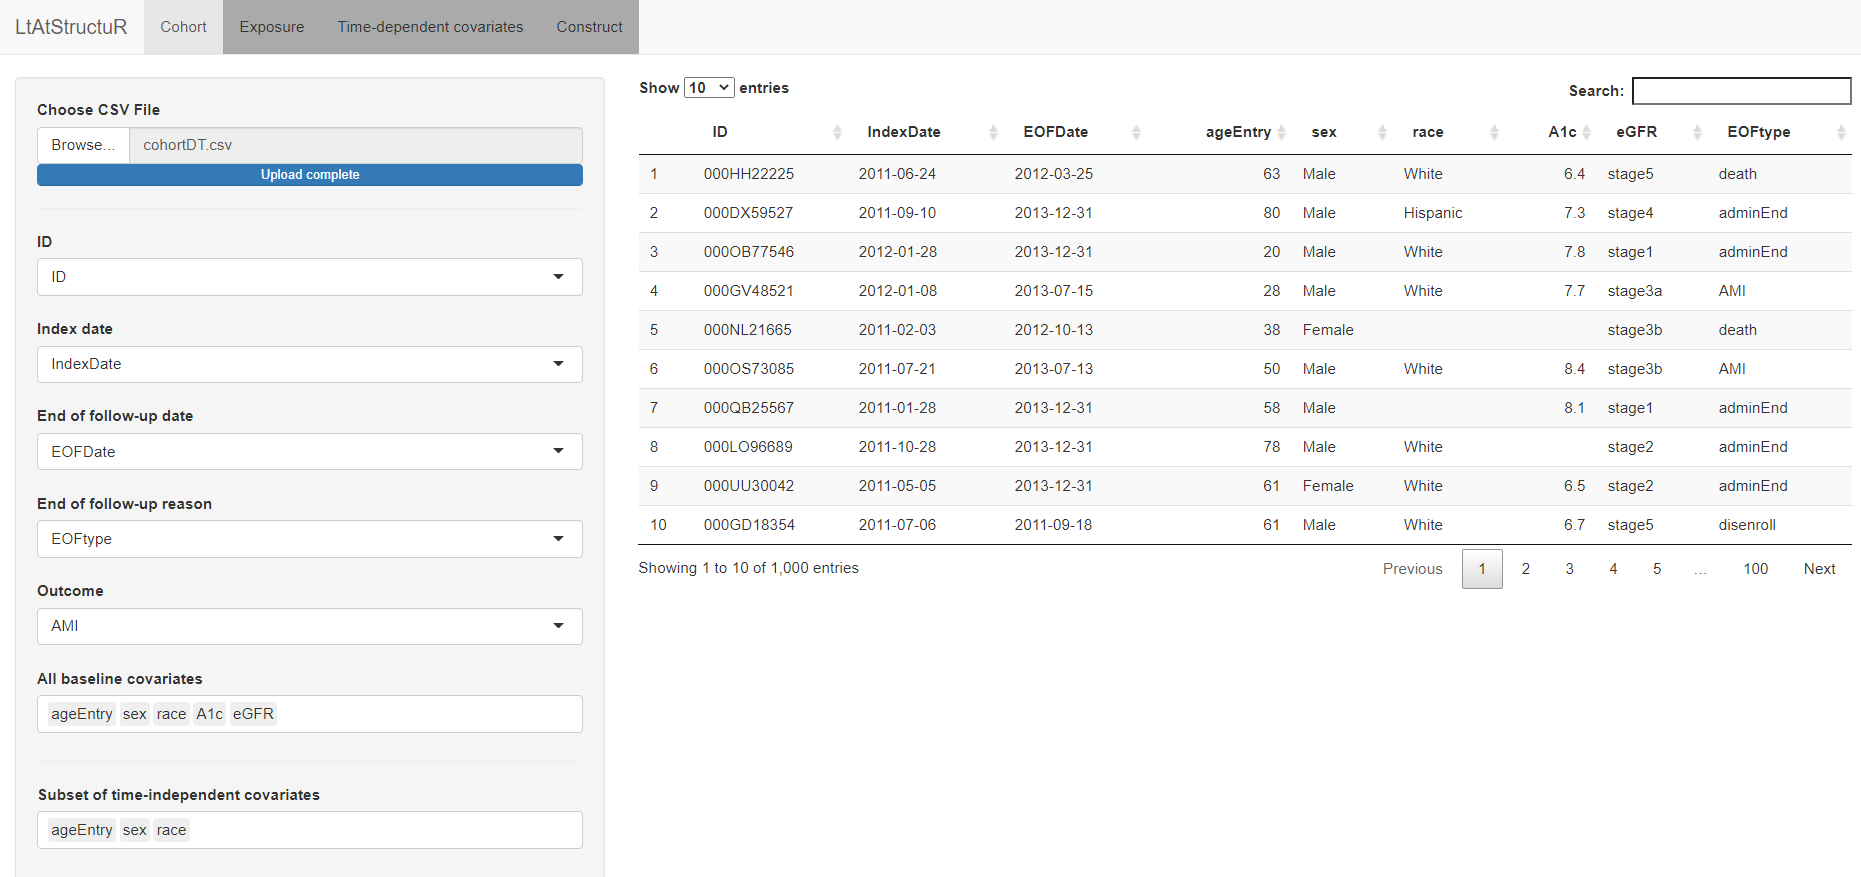
exp_threshold = 0.75)LtAtStructuR can also also be used through an interactive Shiny web
application that automates the process of defining the cohort, exposure,
and covariate datasets. The shiny application currently only supports
interval exposures.
The shiny application can be executed by running the command:
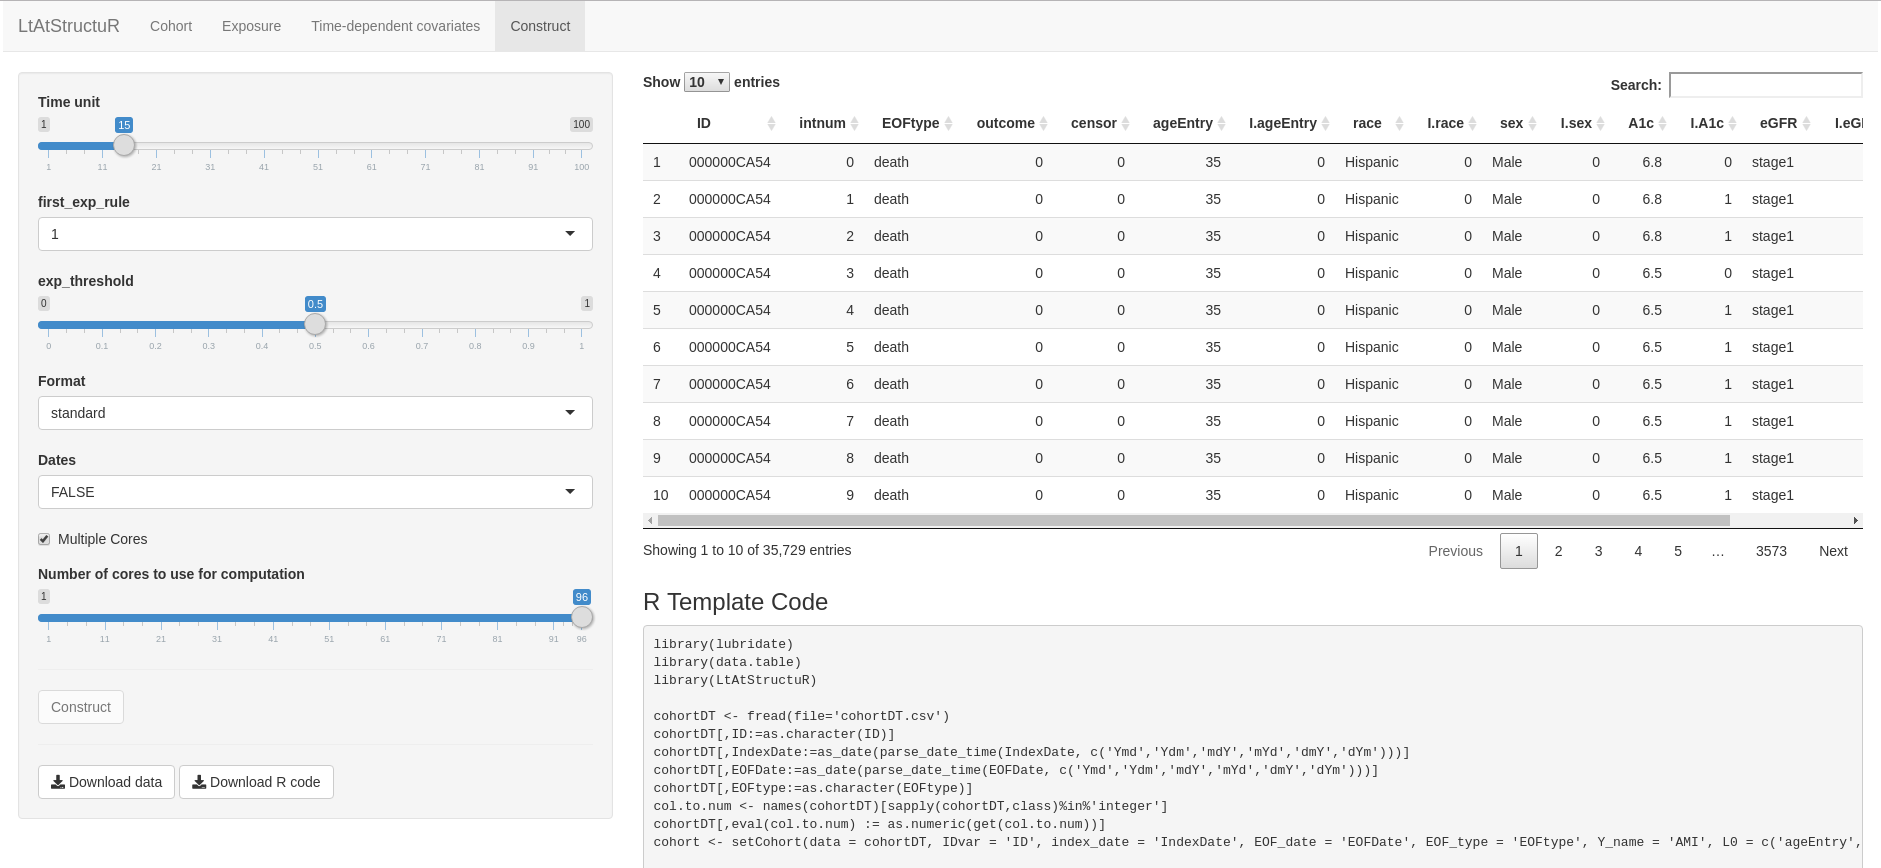
runShiny()The tabs Cohort, Exposure, Covariates, and Construct are
analogous to the setCohort, setExposure, setCovariate, and
construct functions, respectively; each tab offers an interactive
user-interace to select input criteria pertaining to each of these
functions. As a final step of the application, the user can download the
output dataset and R template code specific to the construction of that
dataset:
© 2019 Romain S. Neugebauer
The contents of this repository are distributed under the GPL-3 license.
See file LICENSE for details.

