D3HexMap - Tesselating the World with Hexagon Tiles
This repo is a companion demo for the article on Interactive Hex World Map using D3 http://bennycheung.github.io/interactive-hex-world-map-using-d3
We wonder if marrying a hexagonal tile system with the traditional geographic system (longitude/latitude) will provide a better reasoning and visual perception.
How to Run
Go into D3HexMap directory,
- for python 2.x
python -m SimpleHttpServer
- for python 3.x
python3 -m http.server
or use any Http server to serve this site.
Navigate from the browser to http://localhost:8000 (default port is 8000)
to see the main page index.html.
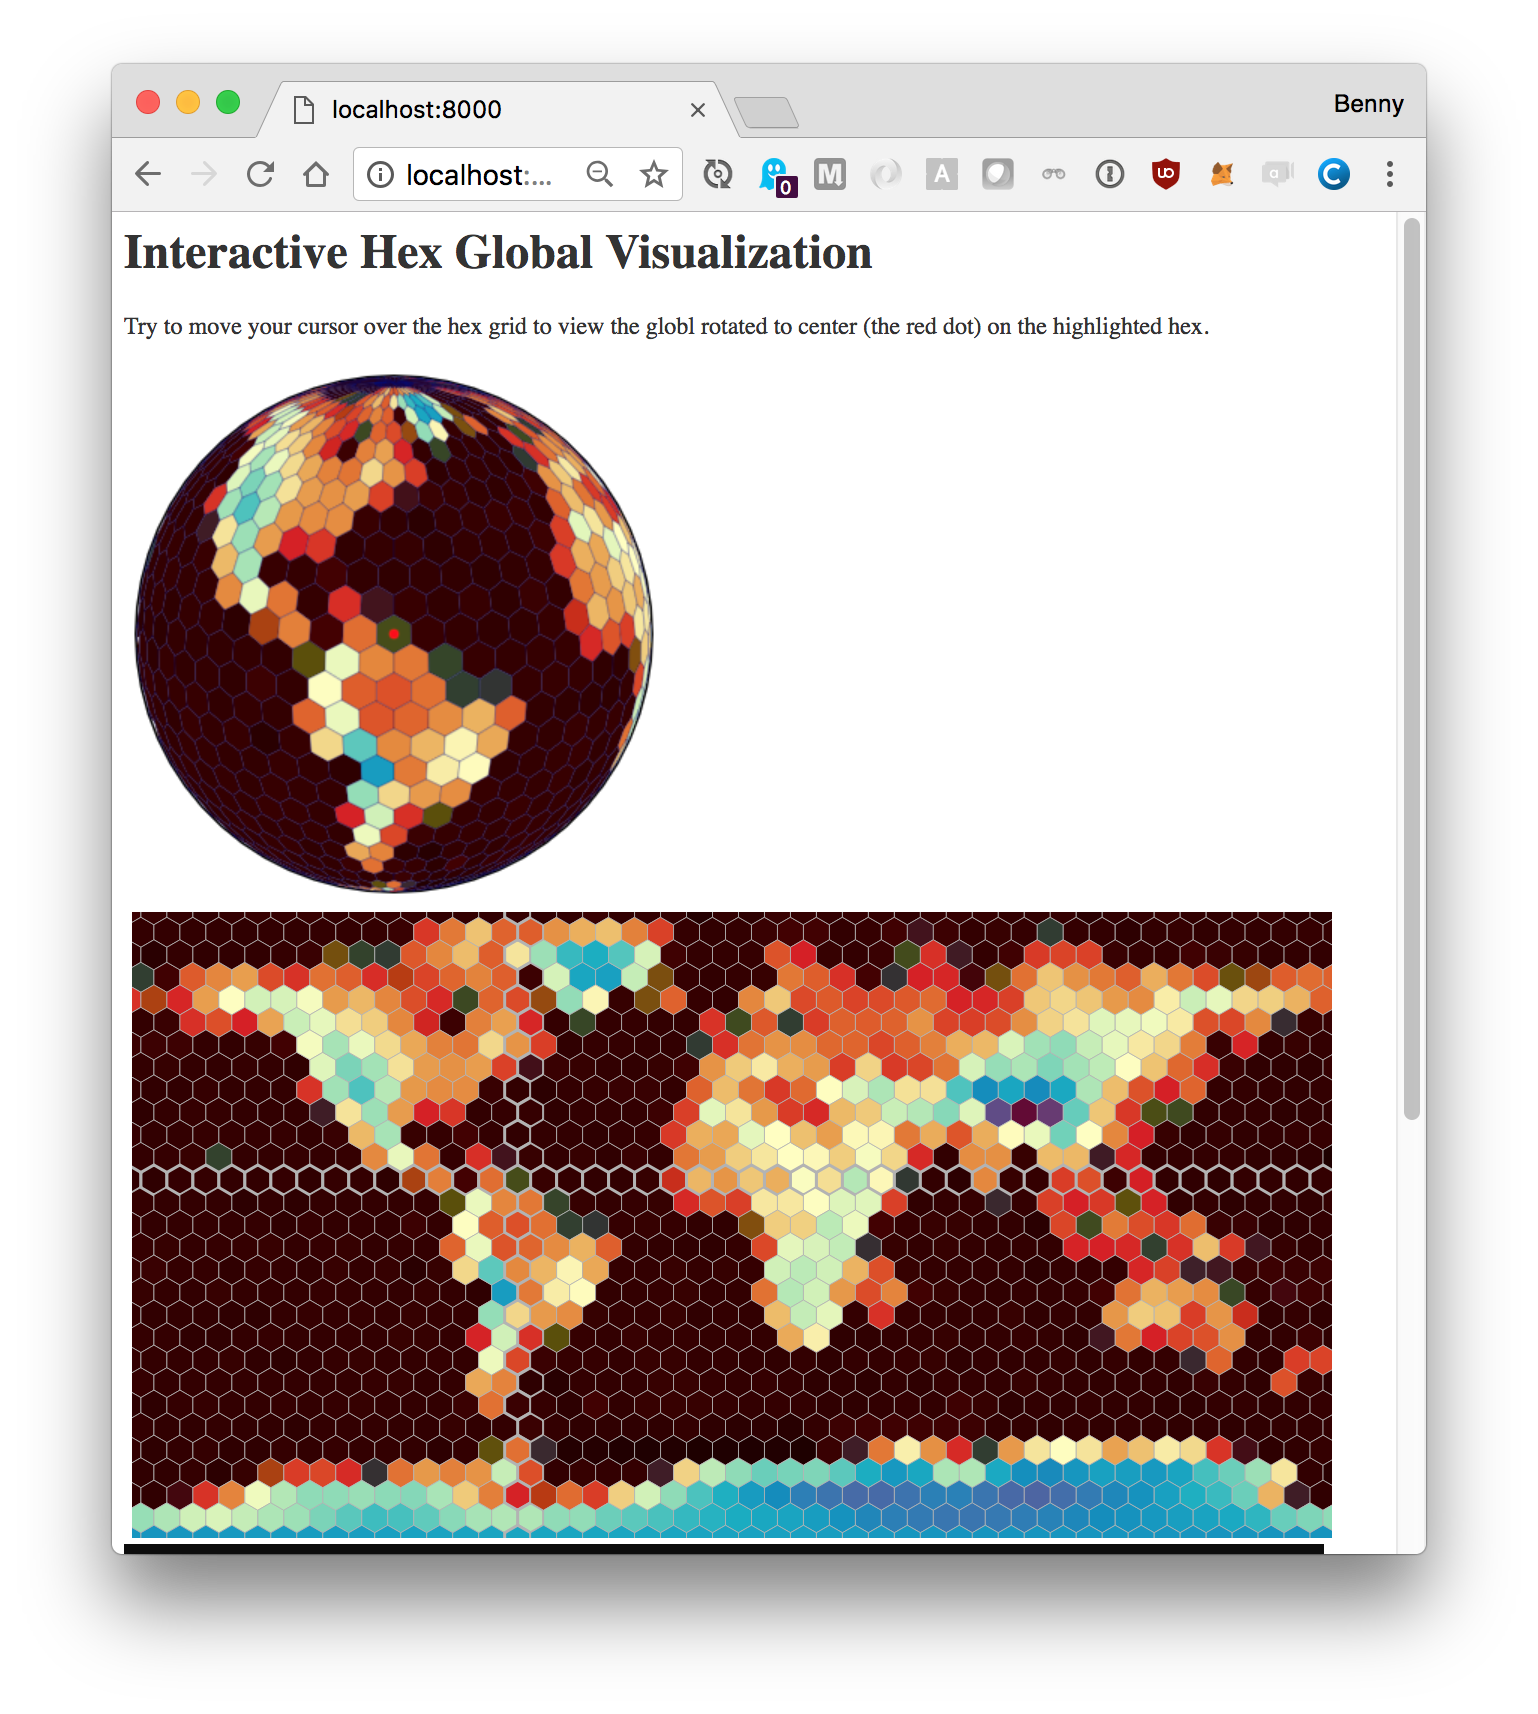
Then you should see the following,

Implementation Details
hexlib.js
The hexagonal representation and mathematic functions are implemented in hexlib.js,
which is essentially Amit's Hex Grid implementation, details are here https://www.redblobgames.com/grids/hexagons/implementation.html
hexlib_ui.js
The hex grid interactivity is provided by hexlib_ui.js,
which is carefully extracted and cleaned up from the hexagon explanation page at http://www.redblobgames.com/grids/hexagons.html,
making the code has minimal dependencies so that the script can be easily reused on other pages.
The makeGridDiagram(svg, cubes) will take,
- Convert a list of hexagonal cube object, and create a list of nodes = {cube: Cube object, key: string, node: d3 selection of containing polygon}
- Make diagram = d3 selection of root of diagram
- Make polygons = d3 selection of the hexagons inside the per tile
- Define update = function(scale, orientation) to call any time orientation changes, including initialization
- Setup onLayout = callback function that will be called before an update (to assign new cube coordinates);this will be called immediately on update
- Setup onUpdate = callback function that will be called after an update; this will be called after a delay, and only if there hasn't been another update
The hex grid diagram is later called with addHexCoordinates() from hexglobe.js function makeHexOddR();
this is how the interactivity of the mouse movement is detected.
If the mouse is over the hex grid,
the selected (row,column) cells are classed with highlighting, and the globe's updateGlobe() function is called with the selected cell (lon, lat) for the globe rotation and view.
hexglobe.js
Finally with the support of previous routines,
the hexglobe.js adds a set of convenience functions to build the interactive hex grid and globe for the visualization. They are briefly described here,
makeHexOddR(svg, hexsize, width, height)- create a "odd-r" hex grid, with the given hexagon pixels size, and the width, height of the reference terrain image.
screenToLonLat(grid_odd_r, screenPoint)- transform the screen coordinate on the image to (lon, lat) point
hexToLonLatHex(grid_odd_r, hex)- transform the hex grid (q, r) coordinate to a polygon with the list of (lon, lat) points
hexWorldGrid(grid_odd_r)- create topojson line features for the hex world grid
makeHexBinMap(grid_odd_r, hexbin_id, hexsize, image_url, width, height)- define d3.hexbin
- define the color gradient map
- read the terrain image and hexbin() each pixel value
- for each hex, find the average of the pixel values
- for each hex, map the average pixel value to a color, according to it's gradient range.
- construct the world hex "odd-r" grid with all the colored hex polygons
The globe is constructed from world-110m.json topojson file, then the hex grid is projected onto the globe surface. A timer is setup to check if the globe's projection has been updated; consequently, the global will be rotated and redrawn to center at the given (lon, lat) location.