The purpose of this repository is to offer a step-by-step guide for running xk6-disruptor in a local development environment using a demo application.
You can try this demo on an interactive environment on Killercoda. We'll take care of setting up Kubernetes and the sock-shop demo application for you so you can focus on learning the basics of xk6-disruptor.
If you prefer to run the demo entirely on your local machine, you can find instructions on how to proceed below.
This tutorial assumes that you are familiar with Kubernetes concepts such as deploying applications and exposing them using services.
Even when will provide all the required commands in this tutorial, it would also be convenient if you have some familiarity with using kubectl for managing applications in Kubernetes.
⚠️ The demo has been tested on Linux and Windows 11 - using a Windows Terminal. It might not work with other OS.
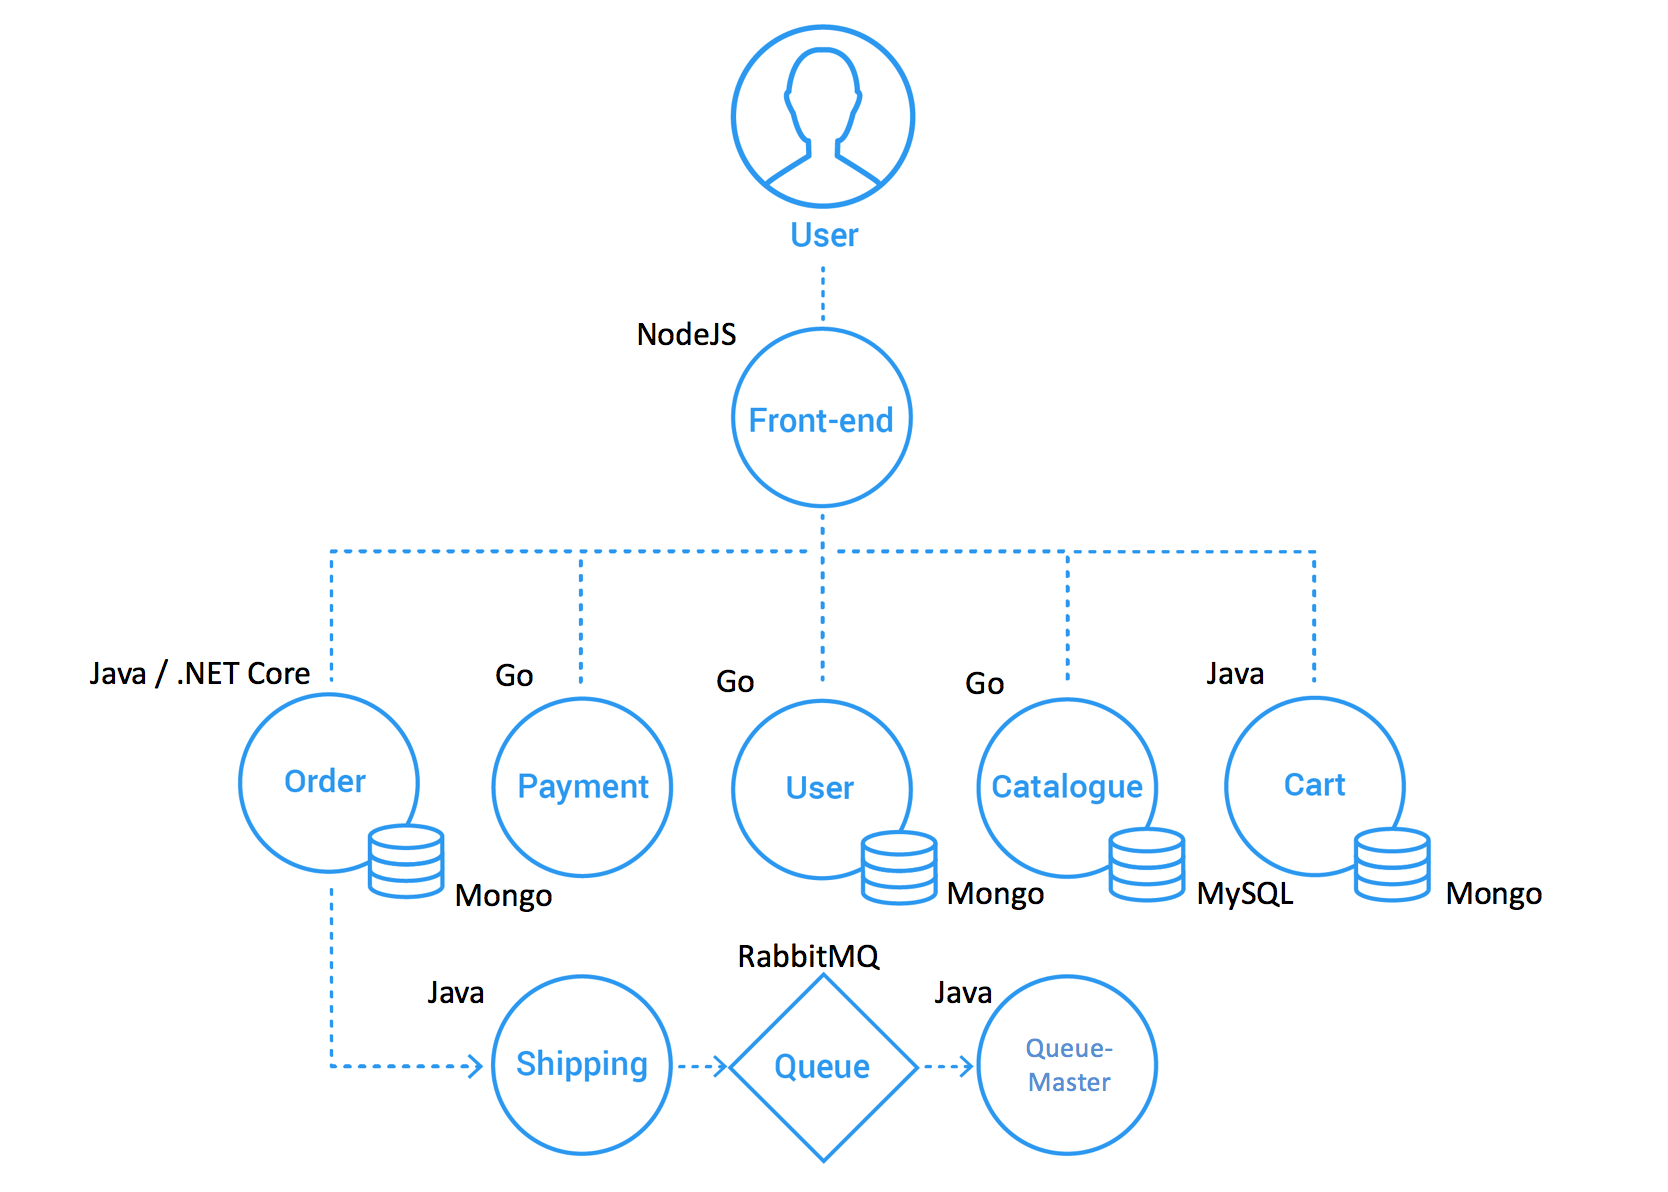
In this demo, we will be working with the Socks-shop application. This application implements a fully functional e-Commerce site that allows users to register, browse the catalog, and buy items. It follows a polyglot microservices-based architecture shown in the figure below. Each microservice has its own API that can be accessed directly using its corresponding Kubernetes service. The front-end service works as a backend for the web interface but also exposes the APIs of other services, working as a kind of API gateway.
xk6-disruptor is a k6 extension. To use it in a k6 test script, it is necessary to use a custom build of k6 that includes it. You can get the binaries for different platforms from the xk6-disruptor github repository. Refer to the Installation Guide for more information.
The rest of this tutorial assumes
xk6-disruptorbinary is available in the system path. In other words, you can invoke it just by typingxk6-disruptor. If this is not the case, you will have to modify the commands in this tutorial accordingly.
For this demo, we will be using a local Kubernetes cluster deployed using Kind. Kind is a tool to run local Kubernetes clusters using Docker containers to emulate nodes.
For the setup, you will also need the kubectl tool.
Follow official documentation depending on your operating system.
Follow the official documentation depending on your operating system.
Create a local cluster with a name demo using the config file provided at manifests\kind-config.yaml. The resulting cluster will be configured to use the host port 38080 to access the ingress controller (see setup ingress below).
kind create cluster --name demo --config manifests/kind-config.yamlOutput:
Creating cluster "demo" ...
 ✓ Ensuring node image (kindest/node:v1.24.0) 🖼
 ✓ Preparing nodes 📦
 ✓ Writing configuration 📜
 ✓ Starting control-plane 🕹️
 ✓ Installing CNI 🔌
 ✓ Installing StorageClass 💾
Set kubectl context to "kind-demo"
You can now use your cluster with:

kubectl cluster-info --context kind-demo

Thanks for using kind! 😊
If you get an error message with the reason
Bind for 0.0.0.0:38080 failed: port is already allocated, it means this port is already in use by another application. You can change the ports used by the cluster editing the port mapping section in themanifests/kind-config.yamlfile. Remember the port used as you will need it later for accessing the application.
We will install the nginx ingress controller to expose services to the host machine:
kubectl apply -f https://raw.githubusercontent.com/kubernetes/ingress-nginx/main/deploy/static/provider/kind/deploy.yamlOutput (some omitted for brevity):
namespace/ingress-nginx created
serviceaccount/ingress-nginx created
serviceaccount/ingress-nginx-admission created
...The xk6-disruptor needs to interact with the Kubernetes cluster on which the application is running. To do so, you must have the credentials to access the cluster in a kubeconfig file.
Use the following command to set this configuration:
kind export kubeconfig --name demoOutput:
Set kubectl context to "kind-demo"The Socks Shop application can be deployed on a Kubernetes cluster applying the manifest with all the required resources using the following command:
kubectl apply -f https://raw.githubusercontent.com/microservices-demo/microservices-demo/master/deploy/kubernetes/complete-demo.yamlOutput (some output omitted for brevity):
deployment.apps/carts created
service/carts created
deployment.apps/carts-db created
service/carts-db created
...
Notice the Socks Shop application is deployed in the sock-shop namespace. To facilitate accessing the application's resources you can set this namespace as the default for kubectl with the following command:
kubectl config set-context --current --namespace sock-shopOutput:
Context "kind-demo" modified.The application can take several minutes to fully deploy. You can check the status of the pods using the following command:
kubectl wait pod --for=condition=Ready --all --timeout=60sIt is possible you receive an output similar to the one shown below, on which some pods are not yet ready. Repeat the command above until all pods return condition met. You can also increase the maximum time the command will wait for the condition to be satisfied by changing the --timeout parameter.
pod/carts-7bbf9dc945-9fpbr condition met
pod/carts-db-67f744dd5f-8htrz condition met
pod/catalogue-db-6b55d8cdb7-4lrlq condition met
pod/front-end-7f5c844b4c-f8zj6 condition met
pod/orders-74f65597c5-9d6pp condition met
pod/orders-db-b76d8c54c-jd8lj condition met
pod/queue-master-9fc44d68d-mgg9s condition met
pod/rabbitmq-6576689cc9-9gs5t condition met
pod/session-db-695f7fd48f-bslkm condition met
pod/shipping-79c568cddc-qzjlp condition met
pod/user-db-b8dfb847c-gl8zc condition met
timed out waiting for the condition on pods/catalogue-6479dbb5bd-dzlnb
timed out waiting for the condition on pods/payment-c7df5b49-kt8jk
timed out waiting for the condition on pods/user-79dddf5cc9-wcrbs
We will create a ingress mapping requests to the local host to the front-end service.
kubectl apply -f manifests/front-end-ingress.yamlOutput:
ingress.networking.k8s.io/front-end-ingress createdYou can test the access to the front-end service with the following command:
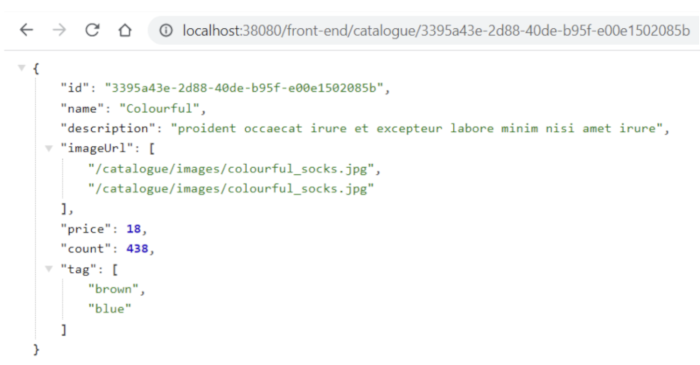
curl -s localhost:38080/front-end/catalogue/3395a43e-2d88-40de-b95f-e00e1502085bOutput:
{"id":"3395a43e-2d88-40de-b95f-e00e1502085b","name":"Colourful","description":"proident occaecat irure et excepteur labore minim nisi amet irure","imageUrl":["/catalogue/images/colourful_socks.jpg","/catalogue/images/colourful_socks.jpg"],"price":18,"count":438,"tag":["brown","blue"]}Notice that the URL uses localhost as the IP address and 38080 as the port. This is the port exposed by the cluster to access the ingress.
If you changed the port mapping in kind you must use that port.
Also, notice the URL includes the /front-end prefix which is used by the ingress for mapping requests to the front-end service.
Using an ingress does not work for accessing the front-end service from a browser, as the URL re-write rule breaks the links to in the HTML document.
If you are running on Windows OS, and the command returns a message cmdlet Invoke-WebRequest at command pipeline position 1 Supply values for the following parameters: Uri:, make sure you are using a Windows Terminal, not Powershell, as documented on stackoverflow. Alternatively, open the browser on the URL http://localhost:38080/front-end/catalogue/3395a43e-2d88-40de-b95f-e00e1502085b and check the resulting JSON.
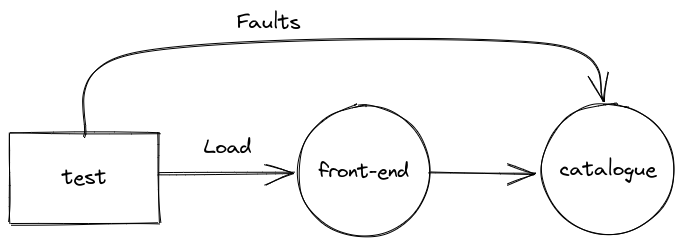
Let's start with a simple chaos test scripts/test-front-end.js. The test applies a load to the Front-end service requesting the description of products from the Catalogue service. At the same time, it injects faults in the Catalogue service.
The faults will cause delays in the requests (up to 100ms over the normal response time) and eventually return the HTTP 500 errors.
Notice the injection of faults in the test is conditioned to the environment variable
INJECT_FAULTSbeing defined with a value1. If this variable is not defined or if its value is not1, the fault injection is skipped. This allows running the same test with and without faults to facilitate comparison.
The test-front-end.js script expects the URL to the front-end service in the SVC_URL environment variable.
On Linux run:
SVC_URL="localhost:38080/front-end"If you are running on Windows OS, set the environment variable on a Windows Terminal:
set SVC_URL="localhost:38080/front-end"We will first run the test without injecting faults.
On Linux run:
xk6-disruptor run --env SVC_URL=$SVC_URL scripts/test-front-end.jsIf you are running on Windows OS, execute:
xk6-disruptor run --env SVC_URL=%SVC_URL% scripts/test-front-end.jsYou should get an output similar to the one shown below:
          /\      |‾‾| /‾‾/   /‾‾/
     /\  /  \     |  |/  /   /  /
    /  \/    \    |     (   /   ‾‾\
   /          \   |  |\  \ |  (‾)  |
  / __________ \  |__| \__\ \_____/ .io

  execution: local
     script: scripts/test-front-end.js
     output: -

  scenarios: (100.00%) 2 scenarios, 101 max VUs, 10m30s max duration (incl. graceful stop):
           * inject: 1 iterations shared among 1 VUs (maxDuration: 10m0s, exec: injectFaults, gracefulStop: 30s)
           * load: 20.00 iterations/s for 1m0s (maxVUs: 5-100, exec: requestProduct, gracefulStop: 30s)


running (01m00.0s), 000/006 VUs, 1202 complete and 0 interrupted iterations
inject ✓ [======================================] 1 VUs        00m00.0s/10m0s  1/1 shared iters
load   ✓ [======================================] 000/005 VUs  1m0s            20.00 iters/s

     ✓ No errors

     checks.........................: 100.00% ✓ 1201      ✗ 0
     data_received..................: 691 kB  12 kB/s
     data_sent......................: 165 kB  2.7 kB/s
     http_req_blocked...............: avg=17.06µs min=6.07µs  med=9.82µs   max=1.08ms   p(90)=13.52µs  p(95)=15.07µs
     http_req_connecting............: avg=4.44µs  min=0s      med=0s       max=485.07µs p(90)=0s       p(95)=0s
     http_req_duration..............: avg=9.37ms  min=5.34ms  med=8.13ms   max=221.39ms p(90)=10.38ms  p(95)=11.29ms
       { expected_response:true }...: avg=9.37ms  min=5.34ms  med=8.13ms   max=221.39ms p(90)=10.38ms  p(95)=11.29ms
     http_req_failed................: 0.00%   ✓ 0         ✗ 1201
     http_req_receiving.............: avg=468µs   min=73.98µs med=391.43µs max=46.01ms  p(90)=662.87µs p(95)=786.08µs
     http_req_sending...............: avg=53.04µs min=29.5µs  med=49.57µs  max=189.28µs p(90)=69.32µs  p(95)=75.64µs
     http_req_tls_handshaking.......: avg=0s      min=0s      med=0s       max=0s       p(90)=0s       p(95)=0s
     http_req_waiting...............: avg=8.85ms  min=5.19ms  med=7.66ms   max=220.09ms p(90)=9.71ms   p(95)=10.69ms
     http_reqs......................: 1201    20.011126/s
     iteration_duration.............: avg=9.86ms  min=48.58µs med=8.62ms   max=222.21ms p(90)=10.89ms  p(95)=11.97ms
     iterations.....................: 1202    20.027788/s
     vus............................: 5       min=5       max=5
     vus_max........................: 6       min=6       max=6
Notice these two metrics from the output above:
checks.........................: 100.00% ✓ 1201      ✗ 0
http_req_duration..............: avg=9.37ms  min=5.34ms  med=8.13ms   max=221.39ms p(90)=10.38ms  p(95)=11.29ms
The checks metric indicates 100% of requests were successful. The percentile 95 of http_req_duration is 11.29ms .
These metrics will be the baseline for the test.
We now will set the INJECT_FAULTS environment variable to enable the fault injection and will run the test again.
On Linux run:
xk6-disruptor run --env SVC_URL=$SVC_URL --env INJECT_FAULTS=1 scripts/test-front-end.jsIf you are running on Windows OS, execute on a Windows Terminal:
xk6-disruptor run --env SVC_URL=%SVC_URL% --env INJECT_FAULTS=1 scripts/test-front-end.jsYou should get an output similar to the one below:
          /\      |‾‾| /‾‾/   /‾‾/
     /\  /  \     |  |/  /   /  /
    /  \/    \    |     (   /   ‾‾\
   /          \   |  |\  \ |  (‾)  |
  / __________ \  |__| \__\ \_____/ .io

  execution: local
     script: scripts/test-front-end.js
     output: -

  scenarios: (100.00%) 2 scenarios, 101 max VUs, 10m30s max duration (incl. graceful stop):
           * inject: 1 iterations shared among 1 VUs (maxDuration: 10m0s, exec: injectFaults, gracefulStop: 30s)
           * load: 20.00 iterations/s for 1m0s (maxVUs: 5-100, exec: requestProduct, gracefulStop: 30s)


running (01m05.3s), 000/006 VUs, 1201 complete and 0 interrupted iterations
inject ✓ [======================================] 1 VUs        01m05.3s/10m0s  1/1 shared itersaverage
load   ✓ [======================================] 000/005 VUs  1m0s            20.00 iters/s

     ✗ No errors
      ↳  89% — ✓ 1073 / ✗ 127

   ✗ checks.........................: 89.41% ✓ 1073      ✗ 127
     data_received..................: 664 kB 10 kB/s
     data_sent......................: 164 kB 2.5 kB/s
     http_req_blocked...............: avg=18.04µs  min=5.95µs  med=10.28µs  max=892.64µs p(90)=13.84µs  p(95)=17.08µs
     http_req_connecting............: avg=4.77µs   min=0s      med=0s       max=699.49µs p(90)=0s       p(95)=0s
     http_req_duration..............: avg=101.43ms min=5.78ms  med=109.45ms max=125.46ms p(90)=112.72ms p(95)=113.67ms
       { expected_response:true }...: avg=101.43ms min=5.78ms  med=109.45ms max=125.46ms p(90)=112.72ms p(95)=113.67ms
     http_req_failed................: 0.00%  ✓ 0         ✗ 1200
     http_req_receiving.............: avg=482.26µs min=80.69µs med=392.02µs max=13.55ms  p(90)=741.59µs p(95)=878.89µs
     http_req_sending...............: avg=55.72µs  min=28.08µs med=50.63µs  max=972.47µs p(90)=70.38µs  p(95)=82.15µs
     http_req_tls_handshaking.......: avg=0s       min=0s      med=0s       max=0s       p(90)=0s       p(95)=0s
     http_req_waiting...............: avg=100.9ms  min=5.52ms  med=109.02ms max=125.12ms p(90)=112.12ms p(95)=112.82ms
     http_reqs......................: 1200   18.376378/s
     iteration_duration.............: avg=156.23ms min=6.25ms  med=109.94ms max=1m5s     p(90)=113.3ms  p(95)=114.35ms
     iterations.....................: 1201   18.391692/s
     vus............................: 1      min=1       max=6
     vus_max........................: 6      min=6       max=6

ERRO[0062] some thresholds have failed
Notice the change in the baseline metrics:
✗ checks.........................: 89.41% ✓ 1073 ✗ 127
and
http_req_duration..............: avg=101.43ms min=5.78ms med=109.45ms max=125.46ms p(90)=112.72ms p(95)=113.67ms
The checks metric now shows that the number of successful requests was nearly 90%, indicating that roughly 10% of requests failed, as expected.
Also, the percentile 95 of the http_req_duration is now 113.67ms, reflecting the 100ms added by the fault injection.
Moreover, notice the message ERRO[0062] some thresholds have failed indicating the ratio of successful checks is below the acceptance level of 97% and therefore the test failed.
- Learn more about k6 and load testing.


