wateRinfo facilitates access to waterinfo.be, a website managed by the Flanders Environment Agency (VMM) and Flanders Hydraulics Research. The website provides access to real-time water and weather related environmental variables for Flanders (Belgium), such as rainfall, air pressure, discharge, and water level. The package provides functions to search for stations and variables, and download time series.
To get started, see:
- Get started: an introduction to the package’s main functionalities.
- Function reference: overview of all functions.
- Articles: tutorials on how to use the package.
You can install the development version of wateRinfo from GitHub with:
# install.packages("devtools")
devtools::install_github("ropensci/wateRinfo")

# Or rOpenSci R-universe
install.packages("wateRinfo", repos = "https://ropensci.r-universe.dev")For a number of supported variables
(documented
by VMM), the stations providing time series data for a given variable
can be listed with the command get_stations().
If you want to know the supported variables, ask for the supported variables:
library(wateRinfo)

supported_variables("en")
#>              variable_en
#> 1              discharge
#> 6        soil_saturation
#> 7          soil_moisture
#> 8  dew_point_temperature
#> 9     ground_temperature
#> 10           ground_heat
#> 11            irradiance
#> 12          air_pressure
#> 13 air_temperature_175cm
#> 14              rainfall
#> 20     relative_humidity
#> 21  evaporation_monteith
#> 25    evaporation_penman
#> 29        water_velocity
#> 34           water_level
#> 39     water_temperature
#> 40        wind_direction
#> 41            wind_speed
Listing the available air pressure stations:
get_stations("air_pressure")
#>      ts_id station_latitude station_longitude station_id station_no
#> 1 78124042         51.20300          5.439589      12213   ME11_002
#> 2 78005042         51.02263          2.970584      12206   ME01_003
#> 3 78039042         51.24379          4.266912      12208   ME04_001
#> 4 78073042         50.88663          4.094898      12210   ME07_006
#> 5 78107042         51.16224          4.845708      12212   ME10_011
#> 6 78022042         51.27226          3.728299      12207   ME03_017
#> 7 78090042         50.73795          5.141976      12211   ME09_012
#> 8 78056042         50.86149          3.411318      12209   ME05_019
#>              station_name stationparameter_name parametertype_name
#> 1             Overpelt_ME                    Pa                 Pa
#> 2               Zarren_ME                    Pa                 Pa
#> 3              Melsele_ME                    Pa                 Pa
#> 4           Liedekerke_ME                    Pa                 Pa
#> 5            Herentals_ME                    Pa                 Pa
#> 6            Boekhoute_ME                    Pa                 Pa
#> 7 Niel-bij-St.-Truiden_ME                    Pa                 Pa
#> 8              Waregem_ME                    Pa                 Pa
#>   ts_unitsymbol dataprovider
#> 1           hPa          VMM
#> 2           hPa          VMM
#> 3           hPa          VMM
#> 4           hPa          VMM
#> 5           hPa          VMM
#> 6           hPa          VMM
#> 7           hPa          VMM
#> 8           hPa          VMM
Each of the stations in the list for a given variable, are represented
by a ts_id. These can be used to download the data of a given period
with the command get_timeseries_tsid(), for example Overpelt
(ts_id = 78124042):
overpelt_pressure <- get_timeseries_tsid("78124042",
                                         from = "2017-04-01",
                                         to = "2017-04-02")
head(overpelt_pressure)
#>             Timestamp  Value Quality Code
#> 1 2017-04-01 00:00:00 1008.8          130
#> 2 2017-04-01 00:15:00 1008.7          130
#> 3 2017-04-01 00:30:00 1008.7          130
#> 4 2017-04-01 00:45:00 1008.6          130
#> 5 2017-04-01 01:00:00 1008.5          130
#> 6 2017-04-01 01:15:00 1008.4          130
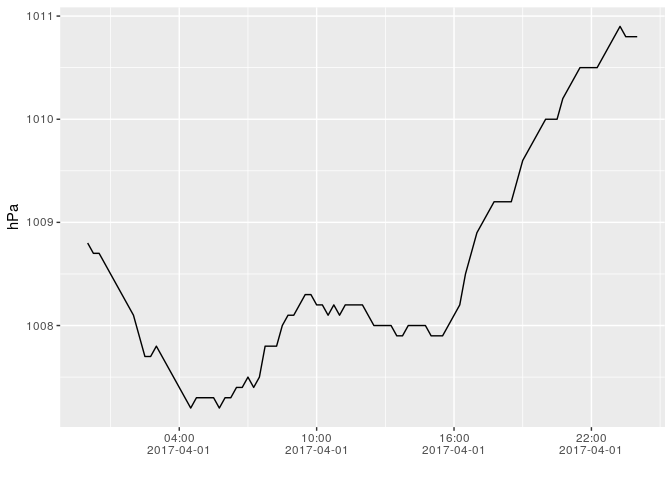
Making a plot of the data with
ggplot2:
library(ggplot2)
ggplot(overpelt_pressure, aes(x = Timestamp, y = Value)) +
    geom_line() +
    xlab("") + ylab("hPa") +
    scale_x_datetime(date_labels = "%H:%M\n%Y-%m-%d", date_breaks = "6 hours")
Another option is to check the available variables for a given station,
with the function get_variables(). Let’s consider again Overpelt
(ME11_002) and check the first ten available variables at the Overpelt
measurement station:
vars_overpelt <- get_variables("ME11_002")
head(vars_overpelt, 10)
#>    station_name station_no    ts_id    ts_name parametertype_name
#> 1   Overpelt_ME   ME11_002 78522042 HydJaarMax                 Ts
#> 2   Overpelt_ME   ME11_002 78523042 HydJaarMin                 Ts
#> 3   Overpelt_ME   ME11_002 78693042       P.15                 Ud
#> 4   Overpelt_ME   ME11_002 94682042   MaandMin                 Ta
#> 5   Overpelt_ME   ME11_002 78531042       P.10                 Ts
#> 6   Overpelt_ME   ME11_002 78518042     DagGem                 Ts
#> 7   Overpelt_ME   ME11_002 78521042 HydJaarGem                 Ts
#> 8   Overpelt_ME   ME11_002 78524042 KalJaarGem                 Ts
#> 9   Overpelt_ME   ME11_002 78533042       P.60                 Ts
#> 10  Overpelt_ME   ME11_002 78694042      Pv.15                 Ud
#>    stationparameter_name
#> 1                  SoilT
#> 2                  SoilT
#> 3                   WDir
#> 4                     Ta
#> 5                  SoilT
#> 6                  SoilT
#> 7                  SoilT
#> 8                  SoilT
#> 9                  SoilT
#> 10                  WDir
Different pre-calculated variables are already available and a ts_id
value is available for each of them to download the corresponding data.
For example, DagGem (= daily mean values) of RH (= relative
humidity), i.e. ts_id = 78382042:
overpelt_rh_daily <- get_timeseries_tsid("78382042",
                                         from = "2017-04-01",
                                         to = "2017-04-30")
head(overpelt_rh_daily)
#>             Timestamp Value Quality Code
#> 1 2017-04-01 23:00:00 80.19          130
#> 2 2017-04-02 23:00:00 89.58          130
#> 3 2017-04-03 23:00:00 79.56          130
#> 4 2017-04-04 23:00:00 84.13          130
#> 5 2017-04-05 23:00:00 84.19          130
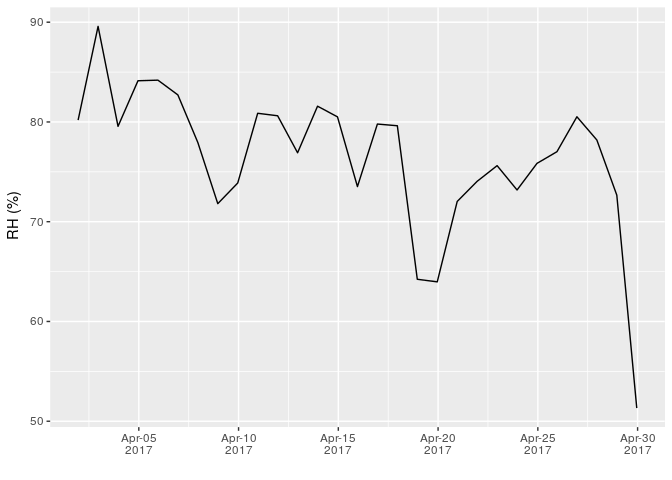
#> 6 2017-04-06 23:00:00 82.71 130ggplot(overpelt_rh_daily, aes(x = Timestamp, y = Value)) +
geom_line() +
xlab("") + ylab(" RH (%)") +
scale_x_datetime(date_labels = "%b-%d\n%Y", date_breaks = "5 days")Unfortunately, not all variables are documented, for which the check for the appropriate variable is not (yet) fully supported by the package.
More detailed tutorials are available in the package vignettes!
The amount of data downloaded from waterinfo.be is limited via a credit system. You do not need to get a token right away to download data. For limited and irregular downloads, a token will not be required.
When you require more extended data requests, please request a download token from the waterinfo.be site administrators via the e-mail address hydrometrie@waterinfo.be with a statement of which data and how frequently you would like to download data. You will then receive a client-credit code that can be used to obtain a token that is valid for 24 hours, after which the token can be refreshed with the same client-credit code.
Get token with client-credit code: (limited client-credit code for testing purposes)
client <- paste0("MzJkY2VlY2UtODI2Yy00Yjk4LTljMmQtYjE2OTc4ZjBjYTZhOjRhZGE4",
                 "NzFhLTk1MjgtNGI0ZC1iZmQ1LWI1NzBjZThmNGQyZA==")
my_token <- get_token(client = client)
print(my_token)
#> Token:
#> eyJhbGciOiJIUzI1NiJ9.eyJqdGkiOiJiNTFlM2U5MC1iY2FjLTQ4Y2ItYmNmOS0wM2NmMDIwODA5MDIiLCJpYXQiOjE2NTcyMTI0NTAsImlzcyI6Imh0dHA6Ly9sb2NhbGhvc3Q6ODA4MC9LaVdlYlBvcnRhbC9hdXRoIiwiYXVkIjoiMzJkY2VlY2UtODI2Yy00Yjk4LTljMmQtYjE2OTc4ZjBjYTZhIiwiZXhwIjoxNjU3Mjk4ODUwfQ.PQv_g2cfrOCdfcpmINZncTAbZgwchzxXwmSjlJU3WIk
#>
#> Attributes:
#>  url: http://download.waterinfo.be/kiwis-auth/token
#>  type: Bearer
#>  expires: 2022-07-08 18:47:30 CEST
Receive information on the validity of the token:
is.expired(my_token)
#> [1] FALSE
Check when the token expires:
expires.in(my_token)
#> Time difference of 23.99999 hours
Use token when retrieving data:
get_stations(variable_name = "verdamping_monteith", token = my_token)
#>      ts_id station_latitude station_longitude station_id station_no
#> 1 94310042         51.02263          2.970584      12206   ME01_003
#> 2 94516042         50.73795          5.141976      12211   ME09_012
#> 3 94530042         51.16224          4.845708      12212   ME10_011
#> 4 94544042         51.20300          5.439589      12213   ME11_002
#> 5 94474042         51.24379          4.266912      12208   ME04_001
#> 6 94502042         50.88663          4.094898      12210   ME07_006
#> 7 94460042         51.27226          3.728299      12207   ME03_017
#> 8 94488042         50.86149          3.411318      12209   ME05_019
#>              station_name stationparameter_name parametertype_name
#> 1               Zarren_ME                   pET                PET
#> 2 Niel-bij-St.-Truiden_ME                   pET                PET
#> 3            Herentals_ME                   pET                PET
#> 4             Overpelt_ME                   pET                PET
#> 5              Melsele_ME                   pET                PET
#> 6           Liedekerke_ME                   pET                PET
#> 7            Boekhoute_ME                   pET                PET
#> 8              Waregem_ME                   pET                PET
#>   ts_unitsymbol dataprovider
#> 1            mm          VMM
#> 2            mm          VMM
#> 3            mm          VMM
#> 4            mm          VMM
#> 5            mm          VMM
#> 6            mm          VMM
#> 7            mm          VMM
#> 8 mm VMMBesides this wateRinfo R client to gather data from waterinfo.be, there is also a Python client available. The pywaterinfo package contains similar functionalities.
The Flanders Hydraulics Research center also distributes clients for R, Python and Matlab upon request to download the data they share on waterinfo.be. For more information, contact them directly via hic@vlaanderen.be.
This package is just a small wrapper around waterinfo.be to facilitate researchers and other stakeholders in downloading the data from waterinfo.be. The availability of this data is made possible by de Vlaamse Milieumaatschappij, Waterbouwkundig Laboratorium, Maritieme Dienstverlening & Kust, Waterwegen en Zeekanaal NV en De Scheepvaart NV.
- We welcome contributions including bug reports.
- License: MIT
- Get citation information for wateRinfo in R doing
citation("wateRinfo"). - Please note that this project is released with a Contributor Code of Conduct. By participating in this project you agree to abide by its terms.


