Build a Traffic Sign Recognition Project
The goals / steps of this project are the following:
- Load the data set (see below for links to the project data set)
- Explore, summarize and visualize the data set
- Design, train and test a model architecture
- Use the model to make predictions on new images
- Analyze the softmax probabilities of the new images
- Summarize the results with a written report
1. Provide a Writeup / README that includes all the rubric points and how you addressed each one. You can submit your writeup as markdown or pdf. You can use this template as a guide for writing the report. The submission includes the project code.
You're reading it! and here is a link to my project code
1. Provide a basic summary of the data set. In the code, the analysis should be done using python, numpy and/or pandas methods rather than hardcoding results manually.
I used the python functions and numpy to calculate summary statistics of the traffic signs data set:
- The size of training set is 34799
- The size of the validation set is 4410
- The size of test set is 12630
- The shape of a traffic sign image is (32, 32, 3) - we have color images!
- The number of unique classes/labels in the data set is 43
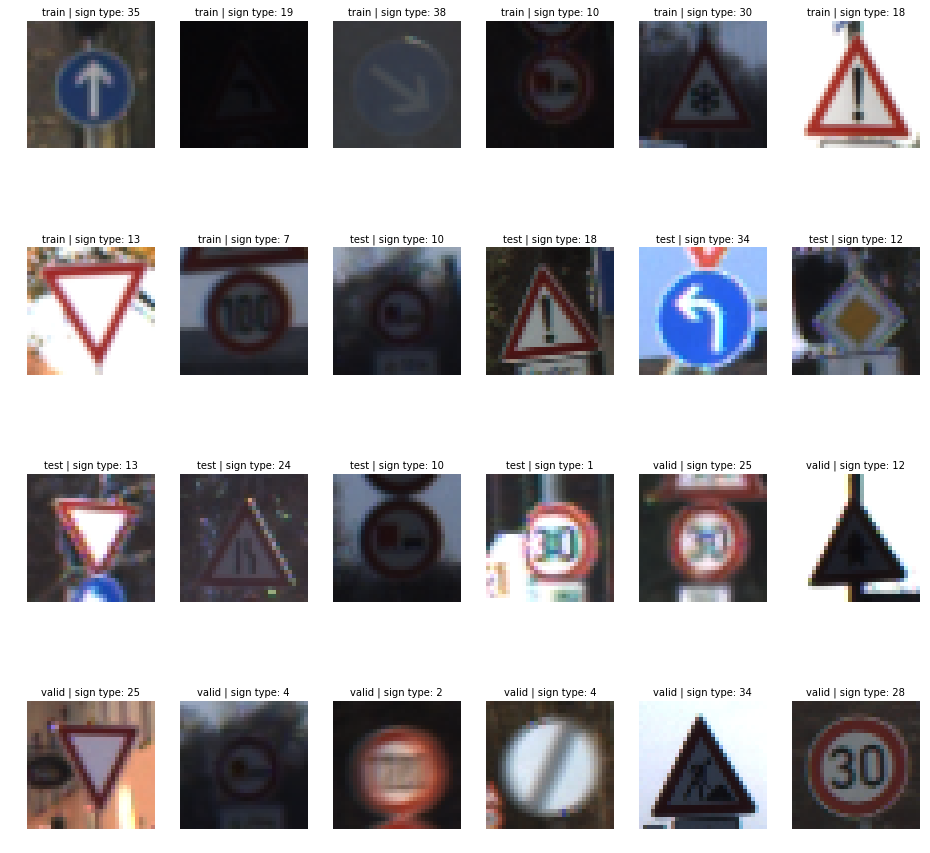
Here is a preview of a random chunk of the images in the dataset:
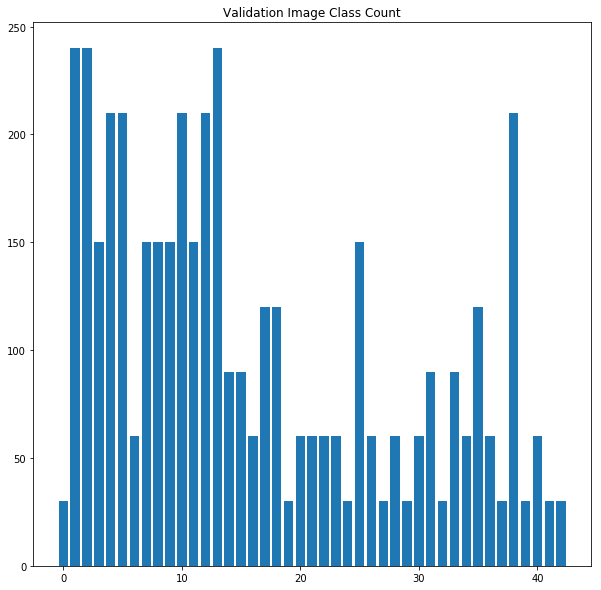
I wanted to see how many images we had for each group, so I used np.unique() to give me the counts for each group, like so:
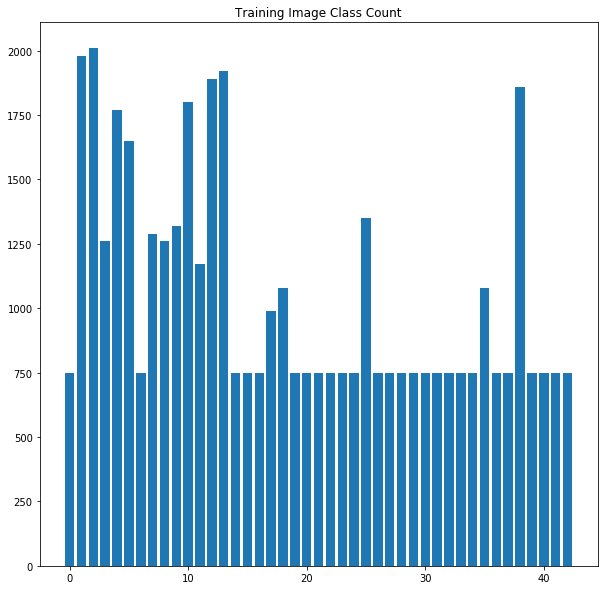
unique, counts = np.unique(y_train, return_counts=True)And created a bar chart of these counts, shown below:
From this, it's pretty easy to see that some of these classes are not represented well. This may prove a challenge when it comes time for training, but I might have some tricks for it!
1. Describe how you preprocessed the image data. What techniques were chosen and why did you choose these techniques? Consider including images showing the output of each preprocessing technique. Pre-processing refers to techniques such as converting to grayscale, normalization, etc. (OPTIONAL: As described in the "Stand Out Suggestions" part of the rubric, if you generated additional data for training, describe why you decided to generate additional data, how you generated the data, and provide example images of the additional data. Then describe the characteristics of the augmented training set like number of images in the set, number of images for each class, etc.)
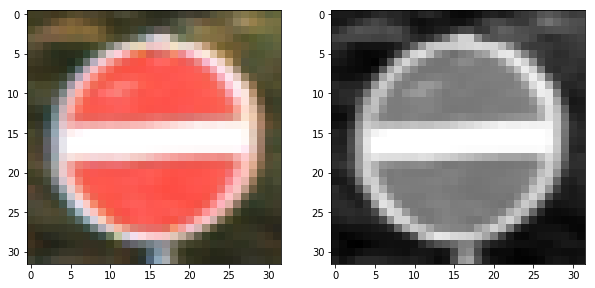
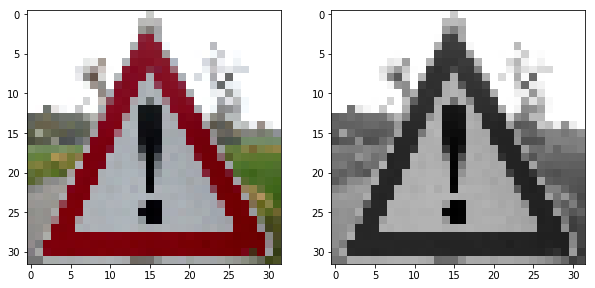
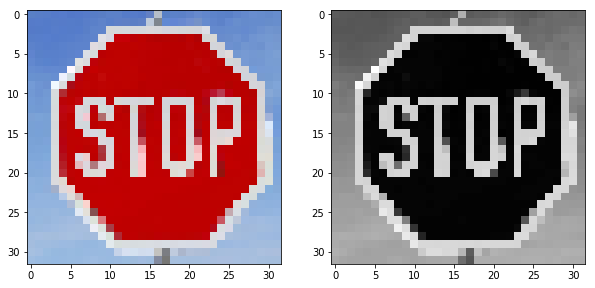
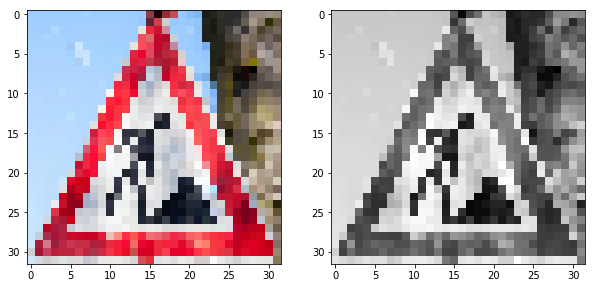
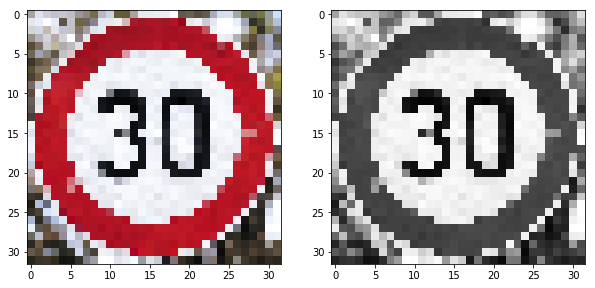
After reading the paper that was linked in the project, Traffic Sign Recognition with Multi-Scale Convolutional Networks, it seemed that converting to grayscale might yield better results, but should also be easier to deal with, so I did that as a first step. Here's an example of an image before and after the grayscale conversion:
I also normalized the image to keep the pixel values between -0.5 and 0.5. This should help the optimizer during training of the model. Here's the function I made to do this:
def normalize(data):
    return (data / 255) - 0.5
After a few training runs with the grayscale and normalization, I still wasn't quite getting the results that I was looking for. I read in the same paper that they augmented their dataset with "jittered data":
we build a jittered dataset by adding 5 transformed versions of the original training set, yielding 126,750 samples in total. Samples are randomly perturbed in position ([-2,2] pixels), in scale ([.9,1.1] ratio) and rotation ([-15,+15] degrees)
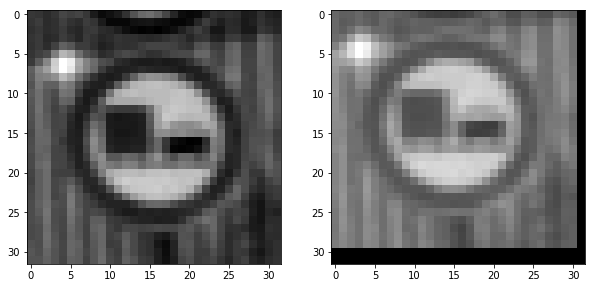
So I decided to try that, since we saw from the bar chart that some of the classes don't have many image samples. Here are some examples from my jittering functions, which where the same as in the paper (scale, rotate, translate).
I added images to each class to bring the count up to 750 for the classes that were under that. Here's what that bar chart of class counts looks like now:
This technique didn't increase the accuracy like I was hoping, but it certainly didn't hurt.
Because I increased the size of the training sample, I decided to split the training data for validation as well, so I didn't have too few validation samples. I split at 15% of the training size, and concatenated the existing validation set with the split data to form my full validation set.
2. Describe what your final model architecture looks like including model type, layers, layer sizes, connectivity, etc.) Consider including a diagram and/or table describing the final model.
My architecture is derived mostly from the LeNet network, with some modifications from this paper.
My model accepts 32x32x1 image as input - I converted all the training images to grayscale hence the 1 color channel input.
Layer 1: Convolutional. The output shape is 28x28x6.
Activation. Tanh activations
Pooling The output shape is 14x14x6.
Layer 2: Convolutional. The output shape is 10x10x16.
Activation. Tanh activation.
Pooling. The output shape is 5x5x16.
Flatten. Flatten the output shape of the final pooling layer such that it's 1D.
Layer 3: Fully Connected. 120 outputs.
Activation. Tanh activation.
Dropout. 50% dropout prob
Layer 4: Fully Connected. 84 outputs.
Activation. Tanh activation.
Dropout. 50% dropout prob
Layer 5: Fully Connected (Logits). 43 outputs.
3. Describe how you trained your model. The discussion can include the type of optimizer, the batch size, number of epochs and any hyperparameters such as learning rate.
To train the model, I used the softmax_cross_entropy_with_logits to calculate the loss, and the Adam Optimizer to minimize the loss on the mean of the cross entropy.
I used a learning rate of 0.001, with a batch size of 128 and 20 EPOCHS. I used the standard mu and standard deviation of 0 and 0.1 respectively in my initial weights. Also, I set my dropout probability to 0.5. There is a section called Training Log in the ipython notebook that goes through all the combinations that I tried.
4. Describe the approach taken for finding a solution and getting the validation set accuracy to be at least 0.93. Include in the discussion the results on the training, validation and test sets and where in the code these were calculated. Your approach may have been an iterative process, in which case, outline the steps you took to get to the final solution and why you chose those steps. Perhaps your solution involved an already well known implementation or architecture. In this case, discuss why you think the architecture is suitable for the current problem.
My final model results were:
-
training set accuracy: 98.8%
-
validation set accuracy: 95.6%
-
test set accuracy: 94.0%
-
What was the first architecture that was tried and why was it chosen?
- I chose to start with the standard LeNet architecture, using the raw images from the dataset provided. It was clear after that initial run that I was going to need to tweak the model to improve the accuracy, as this produced less than 90% accuracy on the validation set.
-
What were some problems with the initial architecture?
- The model was overfitting
-
How was the architecture adjusted and why was it adjusted?
- I read through the paper mentioned in the project, and saw that they mentioned using hyperbolic tangent activation functions, so I tried that and found an increase in accuracy. The authors mention that "Finding the optimal architecture of a ConvNet for a given task remains mainly empirical." So I didn't feel bad using a guess and check approach.
- I thought that adding dropout layers to the network might add some robustness and decrease the overfitting, so I also added these layers after the final two activations and found an improvement in validation accuracy.
- I ended up with a network that is probably overfitting slightly, but it seems to be good enough for our purposes.
-
Which parameters were tuned? How were they adjusted and why?
- I did play around with the learning rate much, as my model seemed to converge given the EPOCH settings. I did, however add more EPOCHs when I increased the size of the training set. I thought that with more data the network might need more time to complete the training, and that seemed to help.
-
What are some of the important design choices and why were they chosen? For example, why might a convolution layer work well with this problem? How might a dropout layer help with creating a successful model?
- The
tanhactivations add another step of non-linearity in the model, which seemed to help the accuracy on the validation set to get it more in line with the training set. - Adding dropout increased the validation accuracy again to get it more in line with the training accuracy.
- Both of these seemed to improve my network's tendency to overfit.
- The
-
How does the final model's accuracy on the training, validation and test set provide evidence that the model is working well?
- Although my network shows some signs of overfitting given that the training accuracy is higher than the validation accuracy, they aren't too dissimilar and both seem to be accurate. Also, after running the model on the test set, I felt better having gotten an accuracy of 94% on unseen data.
1. Choose five German traffic signs found on the web and provide them in the report. For each image, discuss what quality or qualities might be difficult to classify.
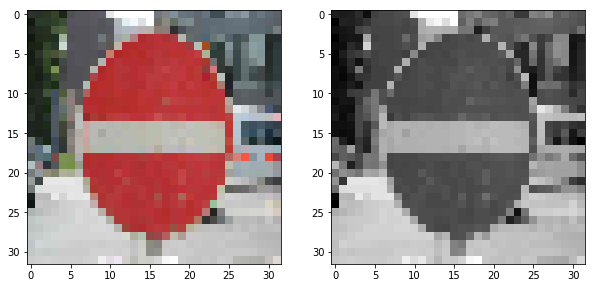
I found five German traffic signs on the web. I cropped them to just include the sign before reading them into python. After I read them in, I resized them to 32x32 and converted them to grayscale. I then normalized them the same way I did with the training data. Here's what they looked like:
I expected the model to have trouble with the 30 km/hr speed limit sign because the numbers get quite pixelated at the 32x32 resolution, so it seemed that the model may struggle classifying a 3 vs a 2 or another number.
Also the 'no entry' and 'road work' signs seemed like they would be a challenge because of the noisiness of the backgrounds. The road work sign has a tree trunk in the background which adds a new shape to the frame, while the 'no entry' sign has a general cityscape backdrop.
2. Discuss the model's predictions on these new traffic signs and compare the results to predicting on the test set. At a minimum, discuss what the predictions were, the accuracy on these new predictions, and compare the accuracy to the accuracy on the test set.
The model was able to correctly guess all 5 new traffic signs, which gives an accuracy of 100%. This compares favorably to the accuracy on the test set of 94%. Maybe I just got lucky, but this makes me feel good about my network choices!
3. Describe how certain the model is when predicting on each of the five new images by looking at the softmax probabilities for each prediction. Provide the top 5 softmax probabilities for each image along with the sign type of each probability.
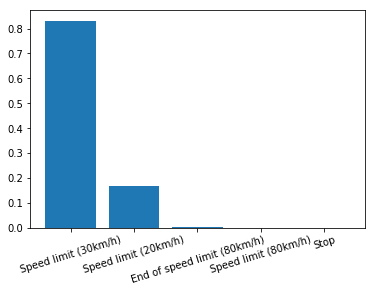
The model seems to be very certain, when making predictions on these new images. The least certain prediction was for "30 km/h speed limit" sign. Here's the bar chart of those probabilities:
And here are the values for those bars.
| Probability | Prediction |
|---|---|
| .832 | Speed limit (30km/h) |
| .166 | Speed limit (20km/h) |
| .013 | End of speed limit (80km/h) |
| .0096 | Speed limit (80km/h) |
| .0080 | Stop |
The rest of the images had 99% softmax probabilities.
