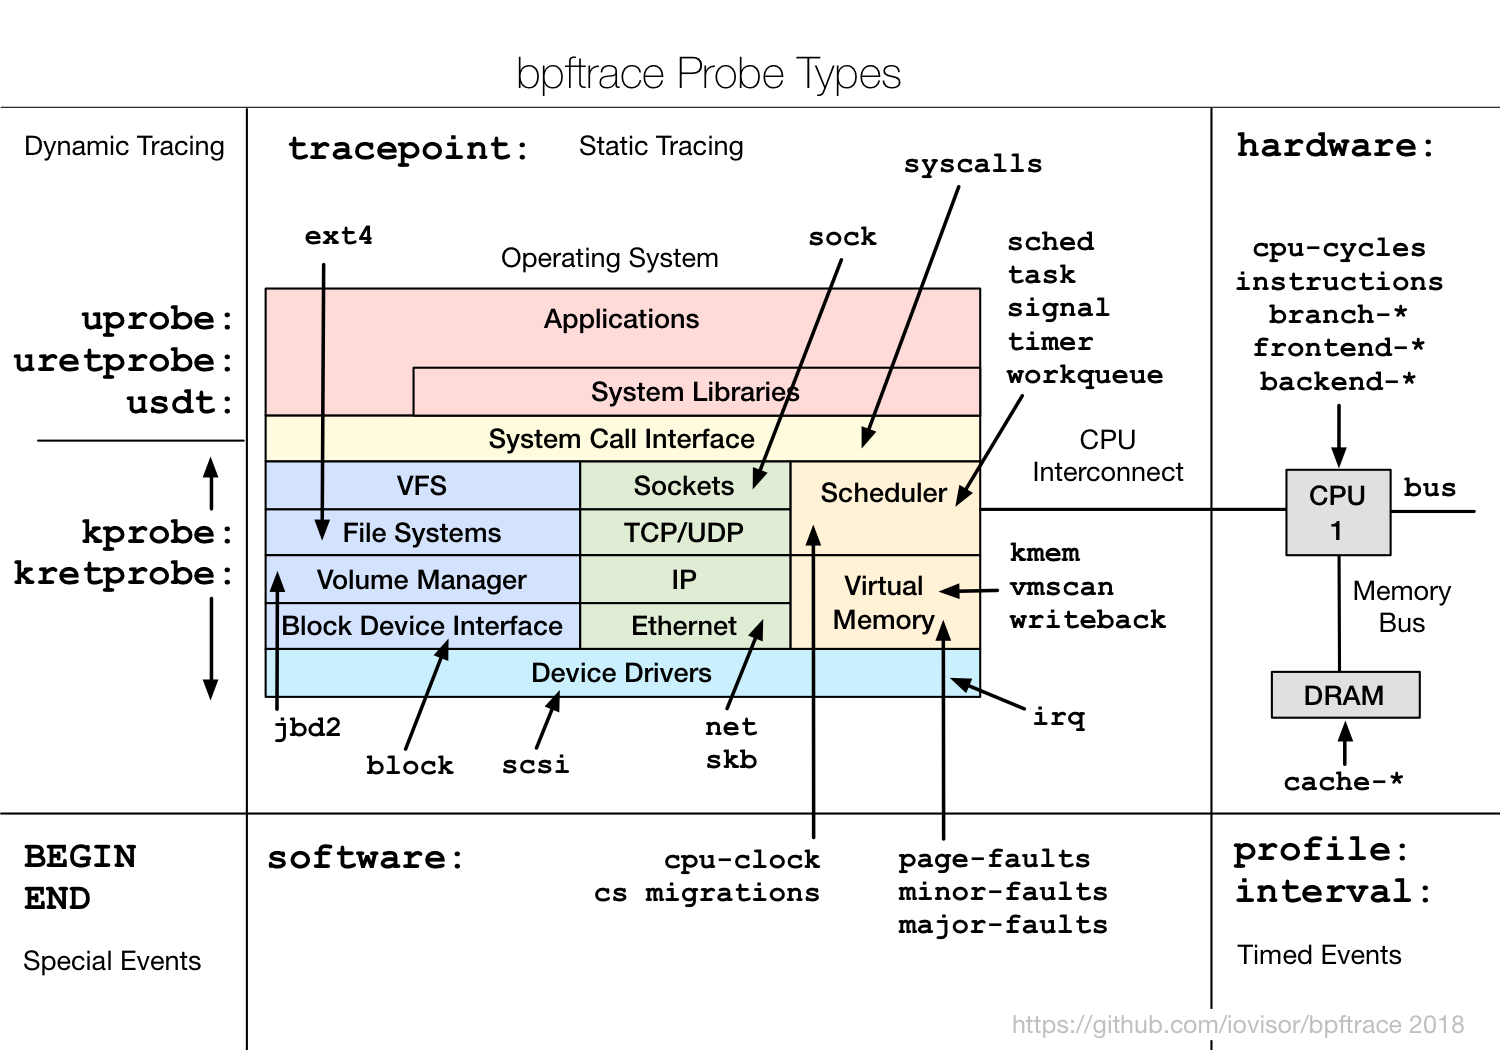
bpftrace is a high-level tracing language for Linux enhanced Berkeley Packet Filter (eBPF) available in recent Linux kernels (4.x). bpftrace uses LLVM as a backend to compile scripts to BPF-bytecode and makes use of BCC for interacting with the Linux BPF system, as well as existing Linux tracing capabilities: kernel dynamic tracing (kprobes), user-level dynamic tracing (uprobes), and tracepoints. The bpftrace language is inspired by awk and C, and predecessor tracers such as DTrace and SystemTap. bpftrace was created by Alastair Robertson.
To learn more about bpftrace, see the Manual the Reference Guide and One-Liner Tutorial.
We are also holding regular office hours open to the public.
The following one-liners demonstrate different capabilities:
# Files opened by process
bpftrace -e 'tracepoint:syscalls:sys_enter_open { printf("%s %s\n", comm, str(args->filename)); }'

# Syscall count by program
bpftrace -e 'tracepoint:raw_syscalls:sys_enter { @[comm] = count(); }'

# Read bytes by process:
bpftrace -e 'tracepoint:syscalls:sys_exit_read /args->ret/ { @[comm] = sum(args->ret); }'

# Read size distribution by process:
bpftrace -e 'tracepoint:syscalls:sys_exit_read { @[comm] = hist(args->ret); }'

# Show per-second syscall rates:
bpftrace -e 'tracepoint:raw_syscalls:sys_enter { @ = count(); } interval:s:1 { print(@); clear(@); }'

# Trace disk size by process
bpftrace -e 'tracepoint:block:block_rq_issue { printf("%d %s %d\n", pid, comm, args->bytes); }'

# Count page faults by process
bpftrace -e 'software:faults:1 { @[comm] = count(); }'

# Count LLC cache misses by process name and PID (uses PMCs):
bpftrace -e 'hardware:cache-misses:1000000 { @[comm, pid] = count(); }'

# Profile user-level stacks at 99 Hertz, for PID 189:
bpftrace -e 'profile:hz:99 /pid == 189/ { @[ustack] = count(); }'

# Files opened, for processes in the root cgroup-v2
bpftrace -e 'tracepoint:syscalls:sys_enter_openat /cgroup == cgroupid("/sys/fs/cgroup/unified/mycg")/ { printf("%s\n", str(args->filename)); }'
More powerful scripts can easily be constructed. See Tools for examples.
For build and install instructions, see INSTALL.md.
bpftrace contains various tools, which also serve as examples of programming in the bpftrace language.
- tools/bashreadline.bt: Print entered bash commands system wide. Examples.
- tools/biolatency.bt: Block I/O latency as a histogram. Examples.
- tools/biosnoop.bt: Block I/O tracing tool, showing per I/O latency. Examples.
- tools/biostacks.bt: Show disk I/O latency with initialization stacks. Examples.
- tools/bitesize.bt: Show disk I/O size as a histogram. Examples.
- tools/capable.bt: Trace security capability checks. Examples.
- tools/cpuwalk.bt: Sample which CPUs are executing processes. Examples.
- tools/dcsnoop.bt: Trace directory entry cache (dcache) lookups. Examples.
- tools/execsnoop.bt: Trace new processes via exec() syscalls. Examples.
- tools/gethostlatency.bt: Show latency for getaddrinfo/gethostbyname[2] calls. Examples.
- tools/killsnoop.bt: Trace signals issued by the kill() syscall. Examples.
- tools/loads.bt: Print load averages. Examples.
- tools/mdflush.bt: Trace md flush events. Examples.
- tools/naptime.bt: Show voluntary sleep calls. Examples.
- tools/opensnoop.bt: Trace open() syscalls showing filenames. Examples.
- tools/oomkill.bt: Trace OOM killer. Examples.
- tools/pidpersec.bt: Count new processes (via fork). Examples.
- tools/runqlat.bt: CPU scheduler run queue latency as a histogram. Examples.
- tools/runqlen.bt: CPU scheduler run queue length as a histogram. Examples.
- tools/setuids.bt: Trace the setuid syscalls: privilege escalation. Examples.
- tools/ssllatency.bt: Summarize SSL/TLS handshake latency as a histogram. Examples
- tools/sslsnoop.bt: Trace SSL/TLS handshake, showing latency and return value. Examples
- tools/statsnoop.bt: Trace stat() syscalls for general debugging. Examples.
- tools/swapin.bt: Show swapins by process. Examples.
- tools/syncsnoop.bt: Trace sync() variety of syscalls. Examples.
- tools/syscount.bt: Count system calls. Examples.
- tools/tcpaccept.bt: Trace TCP passive connections (accept()). Examples.
- tools/tcpconnect.bt: Trace TCP active connections (connect()). Examples.
- tools/tcpdrop.bt: Trace kernel-based TCP packet drops with details. Examples.
- tools/tcplife.bt: Trace TCP session lifespans with connection details. Examples.
- tools/tcpretrans.bt: Trace TCP retransmits. Examples.
- tools/tcpsynbl.bt: Show TCP SYN backlog as a histogram. Examples.
- tools/threadsnoop.bt: List new thread creation. Examples.
- tools/undump.bt: Capture UNIX domain socket packages. Examples.
- tools/vfscount.bt: Count VFS calls. Examples.
- tools/vfsstat.bt: Count some VFS calls, with per-second summaries. Examples.
- tools/writeback.bt: Trace file system writeback events with details. Examples.
- tools/xfsdist.bt: Summarize XFS operation latency distribution as a histogram. Examples.
For more eBPF observability tools, see bcc tools.

See the Reference Guide for more detail.
For additional help / discussion, please use our discussions page.
-
Have ideas for new bpftrace tools? CONTRIBUTING-TOOLS.md
-
Bugs reports and feature requests: Issue Tracker
-
bpftrace development IRC: #bpftrace at irc.oftc.net
-
Development guidelines: developers.md
Please see developers.md for all development related topics.
Copyright 2019 Alastair Robertson
Licensed under the Apache License, Version 2.0 (the "License"); you may not use this file except in compliance with the License. You may obtain a copy of the License at
http://www.apache.org/licenses/LICENSE-2.0
Unless required by applicable law or agreed to in writing, software distributed under the License is distributed on an "AS IS" BASIS, WITHOUT WARRANTIES OR CONDITIONS OF ANY KIND, either express or implied. See the License for the specific language governing permissions and limitations under the License.
