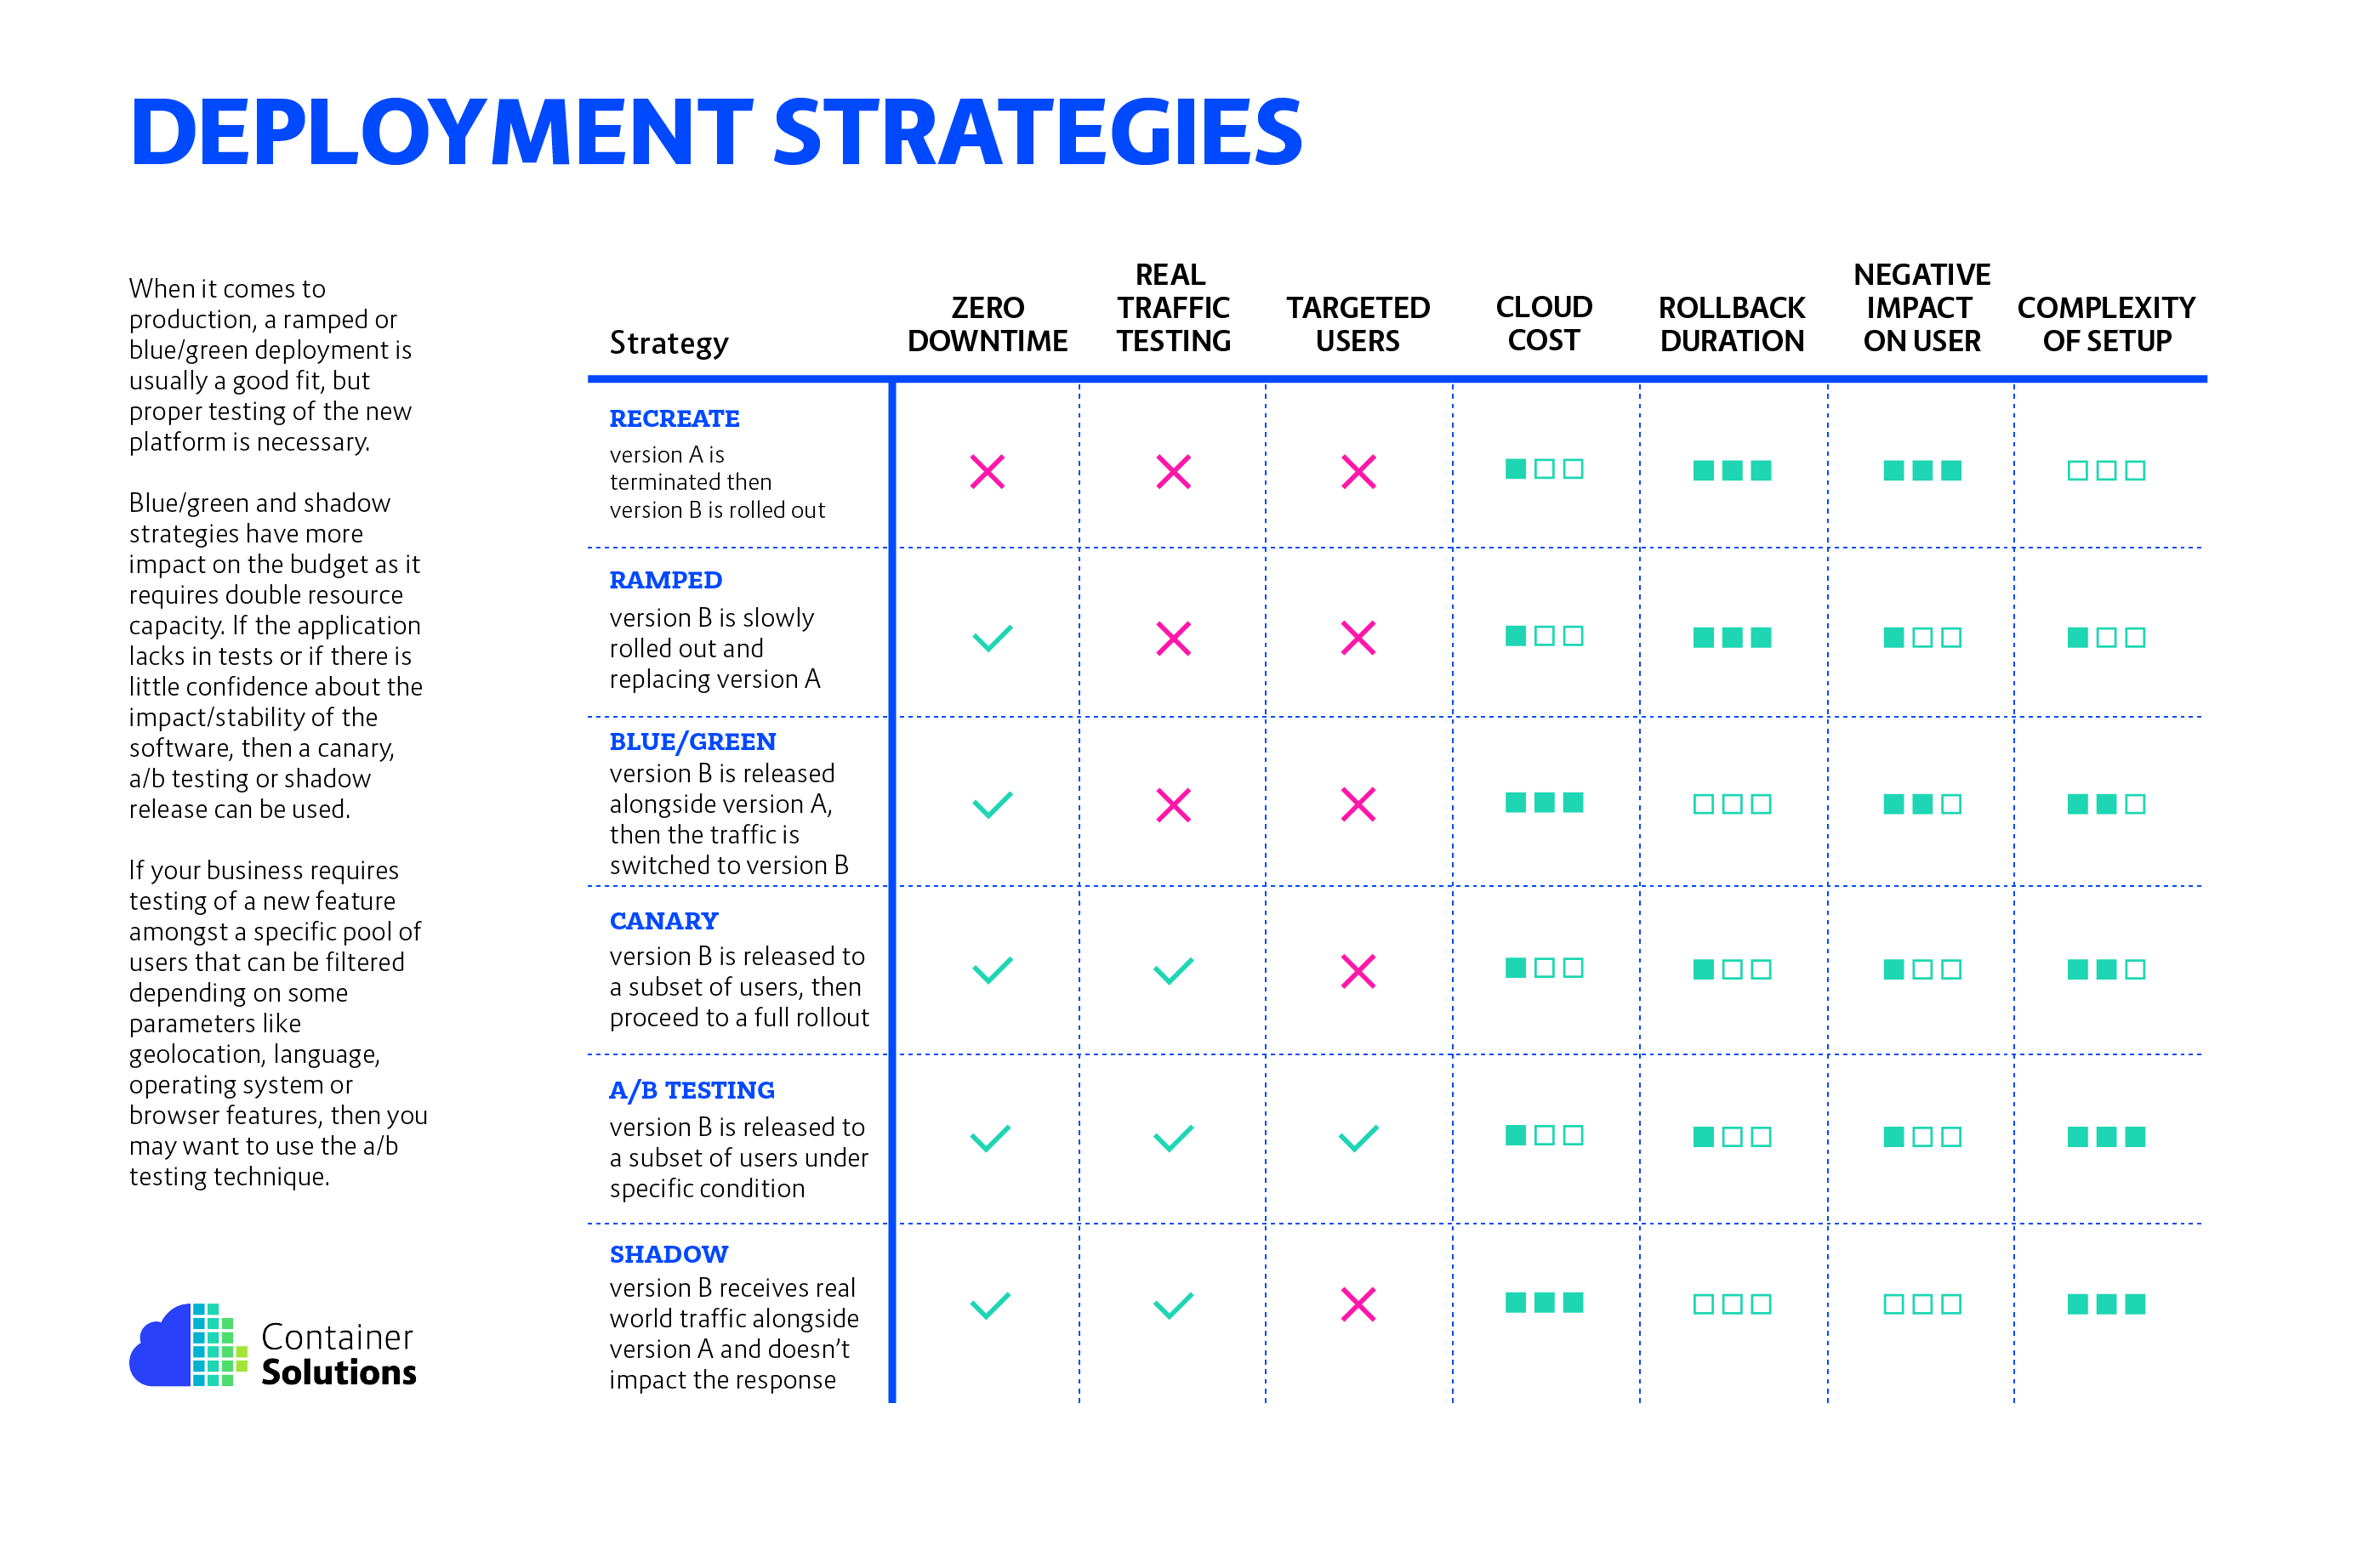
In Kubernetes there is few different way to release an application, you have to carefully choose the right strategy to make your infrastructure relisiant.
Before experimenting, checkout the CNCF prensentation to the blog post about Kubernetes deployment strategies and Six Strategies for Application Deployment.
- recreate: terminate the old version and release the new one
- ramped: release a new version on a rolling update fashion, one after the other
- blue/green: release a new version alongside the old version then switch traffic
- canary: release a new version to a subset of users, then proceed to a full rollout
- a/b testing: release a new version to a subset of users in a precise way (HTTP headers, cookie, weight, etc.). This doesn’t come out of the box with Kubernetes, it imply extra work to setup a smarter loadbalancing system (Istio, Linkerd, Traeffik, custom nginx/haproxy, etc).
- shadow: release a new version alongside the old version. Incoming traffic is mirrored to the new version and doesn't impact the response.
These examples were created and tested on Minikube running with Kubernetes v1.8.0.
$ minikube start --kubernetes-version v1.8.0
The following steps describe how to setup Prometheus and Grafana to visualize the progress and performance of a deployment.
To install Helm, follow the instructions provided on their website.
$ helm init
$ helm install \
    --name=prometheus \
    --version=5.0.1 \
    --set=serverFiles."prometheus\.yml".global.scrape_interval=3s \
    stable/prometheus
$ helm install \
   --name=grafana \
   --version=0.5.7 \
   --set=server.adminUser=admin \
   --set=server.adminPassword=admin \
   --set=server.service.type=NodePort \
   stable/grafana
Now that Prometheus and Grafana are up and running, you can access Grafana:
$ minikube service grafana-grafana
To login, username: admin, password: admin.
Then you need to connect Grafana to Prometheus, to do so, add a DataSource:
Name: prometheus
Type: Prometheus
Url: http://prometheus-prometheus-server
Access: Proxy
Create a dashboard with a Graph. Use the following query:
sum(rate(http_requests_total{app="my-app"}[5m])) by (version)
To have a better overview of the version, add {{version}} in the legend field.
Recreate:
Ramped:
Blue/Green:
Canary:
A/B testing:
Shadow:


