The package includes a custom ggplot geom for visualizing directional wind fields in the four quadrants defined by the cardinal directions (e.g. NE, NW, SW, SE).
You can install this package directly from github using the devtools package:
library(devtools)
install_github("rsizem2/wind-radii-geom")We include a raw dataset which can be used with our new geom. To access
this data, use the get_hurricane_data function, which will return the
data in a format that can be most easily fed into our new geom. We
restrict our attention to a specific observation corresponding to
Hurricane Ike at 6:00 UTC on September 13, 2008, when the hurricane was
just off the Texas coast.
library(hurricane)
library(tidyverse)
library(lubridate)
library(maps)

ike_data <- get_hurricane_data() %>%
    dplyr::filter(startsWith(storm_id, "IKE"),
           datetime %in% lubridate::ymd_hm("2008-09-13 06:00"))
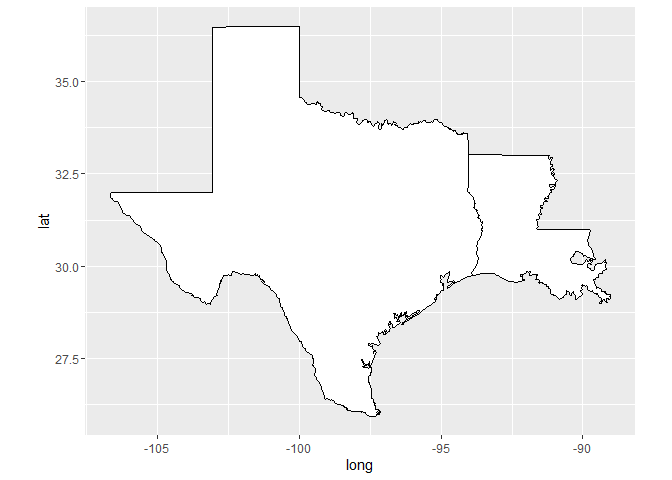
We use the maps package to load map data for more context for our
visualizations, which will be used as the baseplot on which we’ll add
our new geom as a layer. For the sake of our visualization we grab data
for Louisiana and Texas.
gulf_coast <- map_data("state") %>% subset(region %in% c('texas','louisiana'))

base_map <- ggplot(data = gulf_coast) +
    geom_polygon(aes(x = long, y = lat, group = group), fill = "white", color = "black") +
    coord_fixed(1.3)

base_map
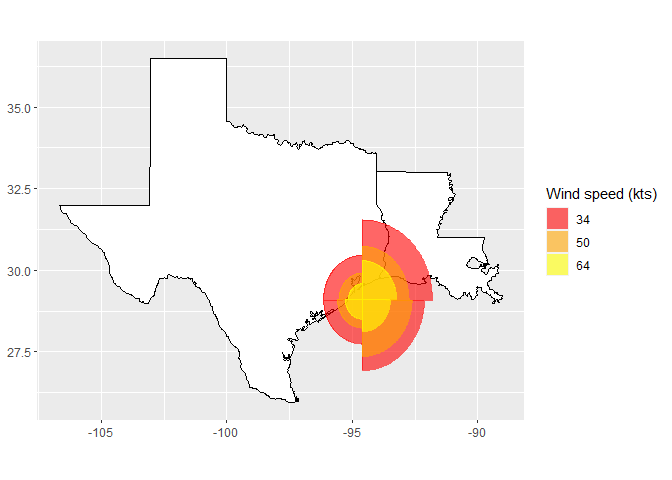
We can then use our geom_hurricane function to add a new layer to this
base plot, using the windspeed columns to determine the colors of each
circular quadrant:
base_map + geom_hurricane(data = ike_data,
                          aes(x = longitude, y = latitude,
                              r_ne = NE, r_se = SE, r_nw = NW,  r_sw = SW,
                              fill = windspeed, color = windspeed, scale_radii = 0.65)) +
    scale_color_manual(name = "Wind speed (kts)",
                       values = c("red", "orange", "yellow")) +
    scale_fill_manual(name = "Wind speed (kts)",
                      values = c("red", "orange", "yellow")) +
    labs(x = NULL, y = NULL)
