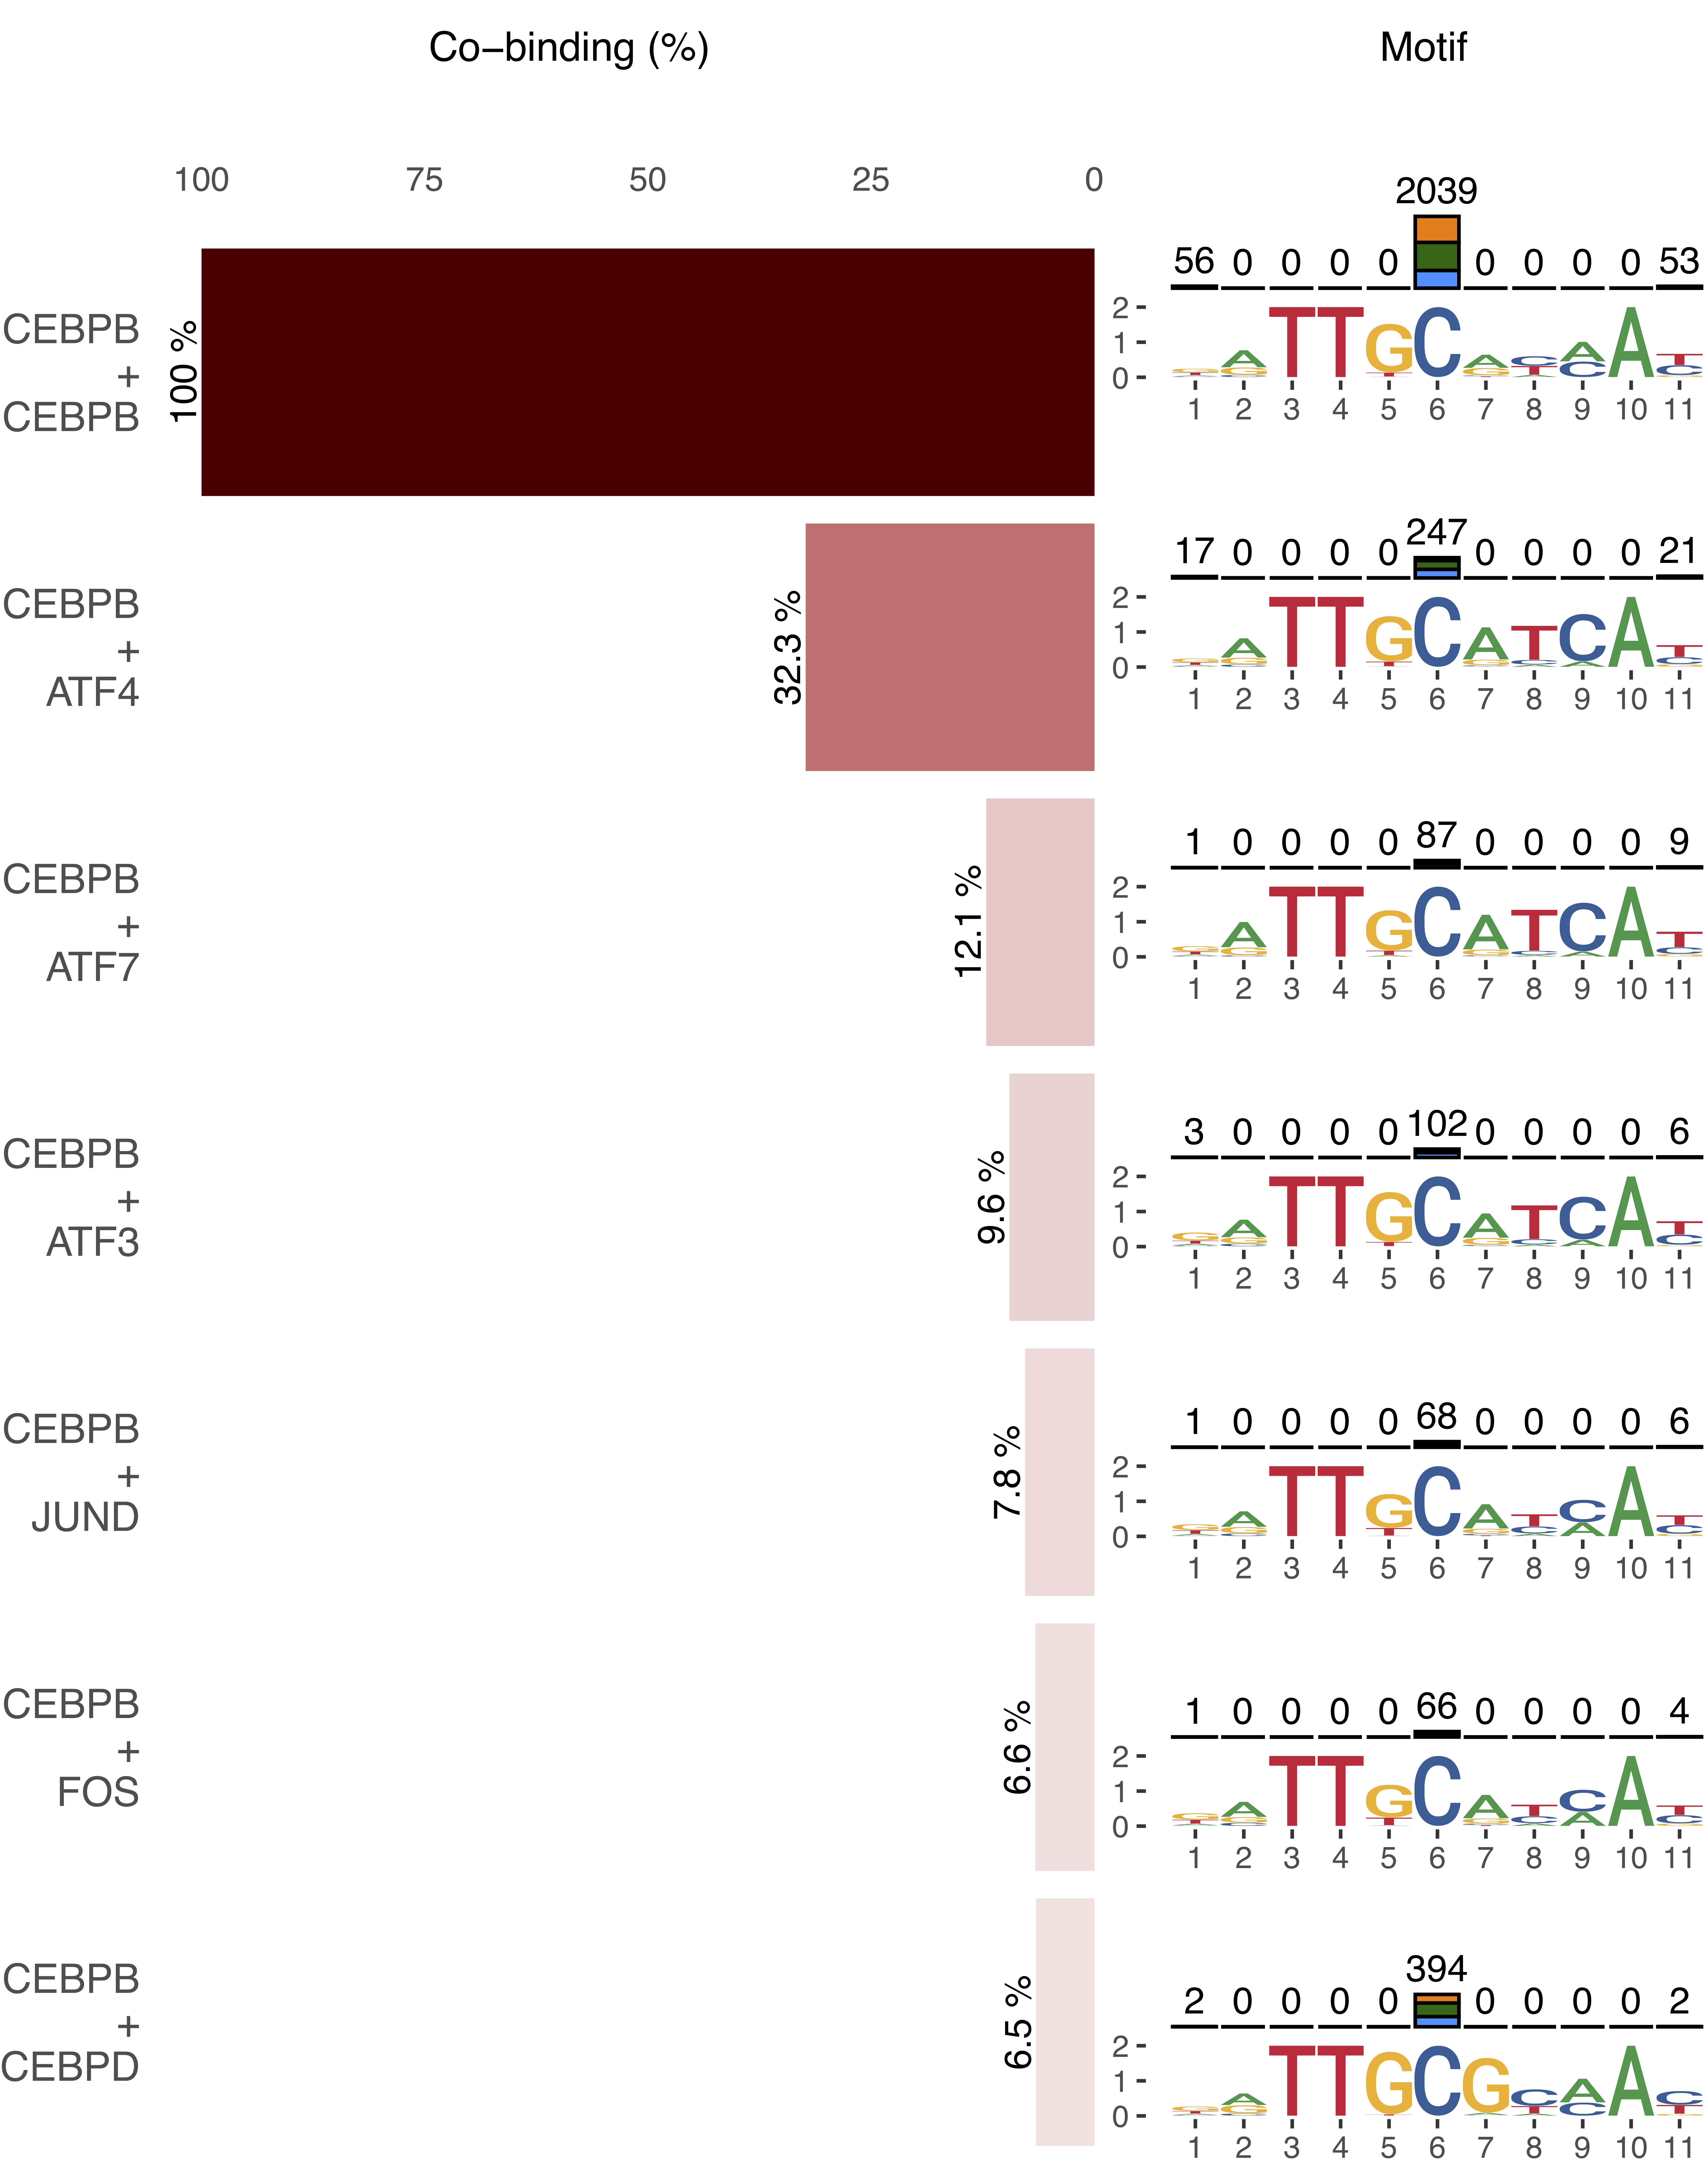
FPWM builds a graph model of multiple PWMs (or Seq-logos) to have a better representation of the different motif a TF uses when binding in complex with other transcription factors.
Type the following in R console:
install.packages("devtools")
library("devtools")
devtools::install_github("https://github.com/benoukraflab/forkedTF")- TFregulomeR (>= 1.2)
- ggplot2 (>= 3.2.1)
- gridExtra (>= 2.3)
- gridGraphics (>= 0.4.1)
- ggseqlogo (>= 0.1)
- cowplot (>= 1.0.0)
- grid (>= 3.6.1)
For an extended view of the options please visit the documentation in our vignette
This function helps in the exploration of binding partners in a cell line. Input the mainTF, cell line of interest and the cobinding_threshold to generate a PDF report of the binding partners.
<<<<<<< HEAD
library("forkedTF")
miniCofactorReport( TF = "CEBPB", cell = "K562",cobinding_threshold=.06)
=======
library("FPWM")
miniCofactorReport( TF = "CEBPB", cell = "K562", cobinding_threshold=.06)
>>>>>>> 3cbca18559f9e1e47d4038b8a0bfde0d610cea27Use the createFPWM function to extract the motif, from empirical datasets, that a TF uses when binding with a partner TF. plotFPWM helps in visualizing the FPWM.
fpwm <- createFPWM(mainTF ="CEBPB",
                        partners = c("ATF4","ATF7","ATF3","JUND","FOS","CEBPD"),
                        cell = "K562",
                        forkPosition = 5,
                        flipMatrix = FALSE)

plotFPWM(fpwm,pdfName="fpwm_plot.pdf")Save the FPWM to a local file can be used in matrix scanning or matrix clustering in transfact format or FPWMtransfact format. Transfact format will have a matrix for each interacting partner in the FPWM, while FPWMtransfact will output a single matrix.
write.FPWM(FPWM = fpwm, format = "transfac", fileName = "FPWM.transfact" )
write.FPWM(FPWM = fpwm, format = "FPWMtransfac", fileName = "FPWM.FPWMtransfac" )
