This repository is intended to hold some of the most useful, higher-level widgets that are native to tkinter. This library is currently compatible with Python 3.5+ (uses type hints), but could easily be back-ported to earlier versions if desired.
For more details, check out the documentation.
Clone this repository, and navigate to the root directory of the install and run the setup.py installer:
$> git clone https://github.com/slightlynybbled/tk_tools
$> cd tk_tools
$> python setup.py installYou can also pip install tk_tools.
Please request additional widgets in the
issues. Contributions
should conform to PEP8 and will be checked against
flake8. To run flake8,
you should install flake8 using pip. As you develop, you can run flake8 ./
from the root directory. If your pull request does not conform to flake8
guidelines, then it may not be accepted until the violations have been fixed!
All widgets are implemented as subclasses of frames and are - as a result - easily used
just as any other widget in tkinter would be utilized. These must be placed in a frame
or toplevel using grid() or pack() just like any other frame.
Examples of these widgets may be found within the examples directory.
Most of the widgets added here fall into three rough classes:
- groups of sub-widgets (i.e. grids)
- visual aids using the canvas (i.e. graph, rotary scale)
- improvements on existing widgets (i.e. dropdown)
Omitted in each are the tkinter setup and run code. As such, it is assumed that all of
the below will have the proper import and a tkinter object called root on which to
populate:
import tkinter as tk
import tk_tools

root = tk.Tk()

# -----------------------------------
# ----- your GUI widget(s) here -----
# -----------------------------------

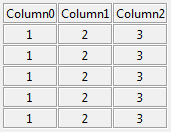
root.mainloop()The LabelGrid is intended to display tabular data easily and effectively.
label_grid = tk_tools.LabelGrid(root, 3, ['Column0', 'Column1', 'Column2'])
label_grid.grid(row=0, column=0)

for _ in range(5):
label_grid.add_row([1, 2, 3])The EntryGrid is a spreadsheet-like grid of entry widgets intended to allow easy entry
of data. When the cursor is in the bottom right entry, pressing <Tab> on your keyboard
will add a new row.
entry_grid = tk_tools.EntryGrid(root, 3, ['L0', 'L1', 'L2'])
entry_grid.grid(row=0, column=0)

for _ in range(5):
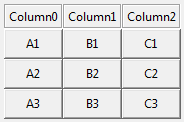
entry_grid.add_row()The ButtonGrid is an grid of buttons like used in a calculator.
button_grid = tk_tools.ButtonGrid(root, 3, ['Column0', 'Column1', 'Column2'])
button_grid.grid()

func = lambda: print("pressed")
button_grid.add_row([("A1", func), ("A1", func), ("C1", func)])
button_grid.add_row([("A2", func), ("B2", func), ("C2", func)])
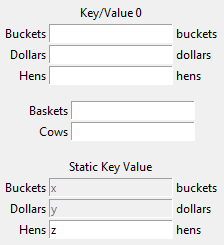
button_grid.add_row([("A3", func), ("B3", func), ("C3", func)])So often, it is necessary to simply extract a key/value from the user. This widget allows
a quick creation of multiple key/value entries and supplies a get() method for easily
retrieving those values as a dictionary. This can also be used as a display widget and may
have or not have titles.
Here, we are shown three key/value entries in various conditions.
# create the key-value with a title
kve0 = tk_tools.KeyValueEntry(
    root,
    title='Key/Value 0',
    keys=['Buckets', 'Dollars', 'Hens'],
    unit_labels=['buckets', 'dollars', 'hens'],
)
kve0.grid(row=0)

# create another key-value set without a title and with no units
kve1 = tk_tools.KeyValueEntry(
    root,
    keys=['Baskets', 'Cows']
)
kve1.grid(row=1)

# create a key-value with some entries disabled, then load values into each
kve2 = tk_tools.KeyValueEntry(
    root,
    title='Static Key Value',
    keys=['Buckets', 'Dollars', 'Hens'],
    unit_labels=['buckets', 'dollars', 'hens'],
    enables=[False, False, True]
)
kve2.grid(row=2)
kve2.load({'Buckets': 'x', 'Dollars': 'y', 'Hens': 'z'})Usually, plotting is done using matplotlib. Unfortunately, this is a pretty serious
installation commitment for some. Here is an alternative simple graphing widget that
may be utilized for some plotting situations.
Note that we can plot individual points, plot lines, and plot lines with points.
# create the graph
graph = tk_tools.Graph(
    parent=root,
    x_min=-1.0,
    x_max=1.0,
    y_min=0.0,
    y_max=2.0,
    x_scale=0.5,
    y_scale=0.5,
    width=500,
    height=400
)

graph.grid(row=0, column=0)

# create an initial line
line_0 = [(x/10, x/10) for x in range(10)]
graph.plot_line(line_0)

# plot the line with points
line_1 = [(x/5 - 1.0, x/10.0) for x in range(10)]
graph.plot_line(line_1, point_visibility=True, color='blue')

# plot a single point
point = (0.5, 0.75)
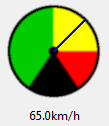
graph.plot_point(*point, color='red')The RotaryScale looks much like a speedometer. It is used when a quick graphical
indicator is needed. It could probably use some look-and-feel improvements, but
will do the job.
p = tk_tools.RotaryScale(root, max_value=100.0, size=100, unit='km/h', needle_thickness=2, needle_color='blue')
p.grid(row=0, column=0)

p.set_value(65.0)The DropDown is an improvement on the OptionMenu in which you don't have to
create a StringVar. It is simply managed as part of the class and is provided for
easy creation of drop down menus.
som = tk_tools.SmartOptionMenu(root, ['one', 'two', 'three'])
som.grid()


def callback():
    print(som.get())

som.add_callback(callback)The SmartSpinBox is an improvement on the SpinBox already available in tkinter.
You simply don't have to create any variables to manage as they are included as part
of the package. The below code illustrates the creation and addition of TWO functions
to the SmartSpinBox. Functions may be added at initialization or later, as desired.
I'm not including a graphic as it looks like any other SpinBox.
ssb = SmartSpinBox(root, 'float', from_=0, to=5, increment=0.1, callback=lambda: print('it works'))
ssb.grid()

print(ssb)

def callback():
    print(ssb.get())

ssb.add_callback(callback)The ByteLabel is an label specifically designed to display byte values in single bits.
It provides methods for easy bit manipulation and can only hold values from 0 to 255.
blabel1 = tk_tools.widgets.ByteLabel(root, 153, "d1:", font="Consolas 12")

blabel1.toggle_bit(1)
blabel1.clear_bit(2)
blabel1.set_bit(4)
blabel1.toggle_msb()

blabel1.grid()