Grafana Prometheus Node-Exporter cAdvisor Loki - Docker Monitoring Stack
Get your monitoring stack up and running with one command using a Docker Compose stack featuring:
- Grafana: Dashboarding.
- Prometheus: Timeseries database for metrics.
- Node-Exporter: Node metrics.
- cAdvisor: Container metrics.
- Alertmanager: Alerting system.
- Uncomplicated Alert Receiver: UI with Received Alerts.
- Loki: Logs (including explore-logs).
Note: Due to docker-compose and the compose plugin, you might have one of the two installed. I have a Makefile that will detect which on you have installed.
You can list the targets using make.
Boot the stack with docker compose (or make up):
docker-compose up -dEnsure all containers are running:
docker-compose psThe output should looke like this:
    Name                      Command                          State          Ports
-----------------------------------------------------------------------------------------------------
cadvisor                      /usr/bin/cadvisor -logtostderr   Up (healthy)   8080/tcp
grafana                       /run.sh                          Up             0.0.0.0:3000->3000/tcp
node-exporter                 /bin/node_exporter --path. ...   Up             9100/tcp
prometheus                    /bin/prometheus --config.f ...   Up             0.0.0.0:9090->9090/tcp
alertmanager                  /bin/alertmanager --config ...   Up             0.0.0.0:9093->9093/tcp
loki                          /usr/bin/loki -conf ...          Up             0.0.0.0:3100->3100/tcp
promtail                      /usr/bin/promtail ...            Up
uncomplicated-alert-receiver  /app/uar                         Up             0.0.0.0:9094->8080/tcp
Access grafana on Grafana Home (or make open) and you should see the three dashboards that was provisioned:
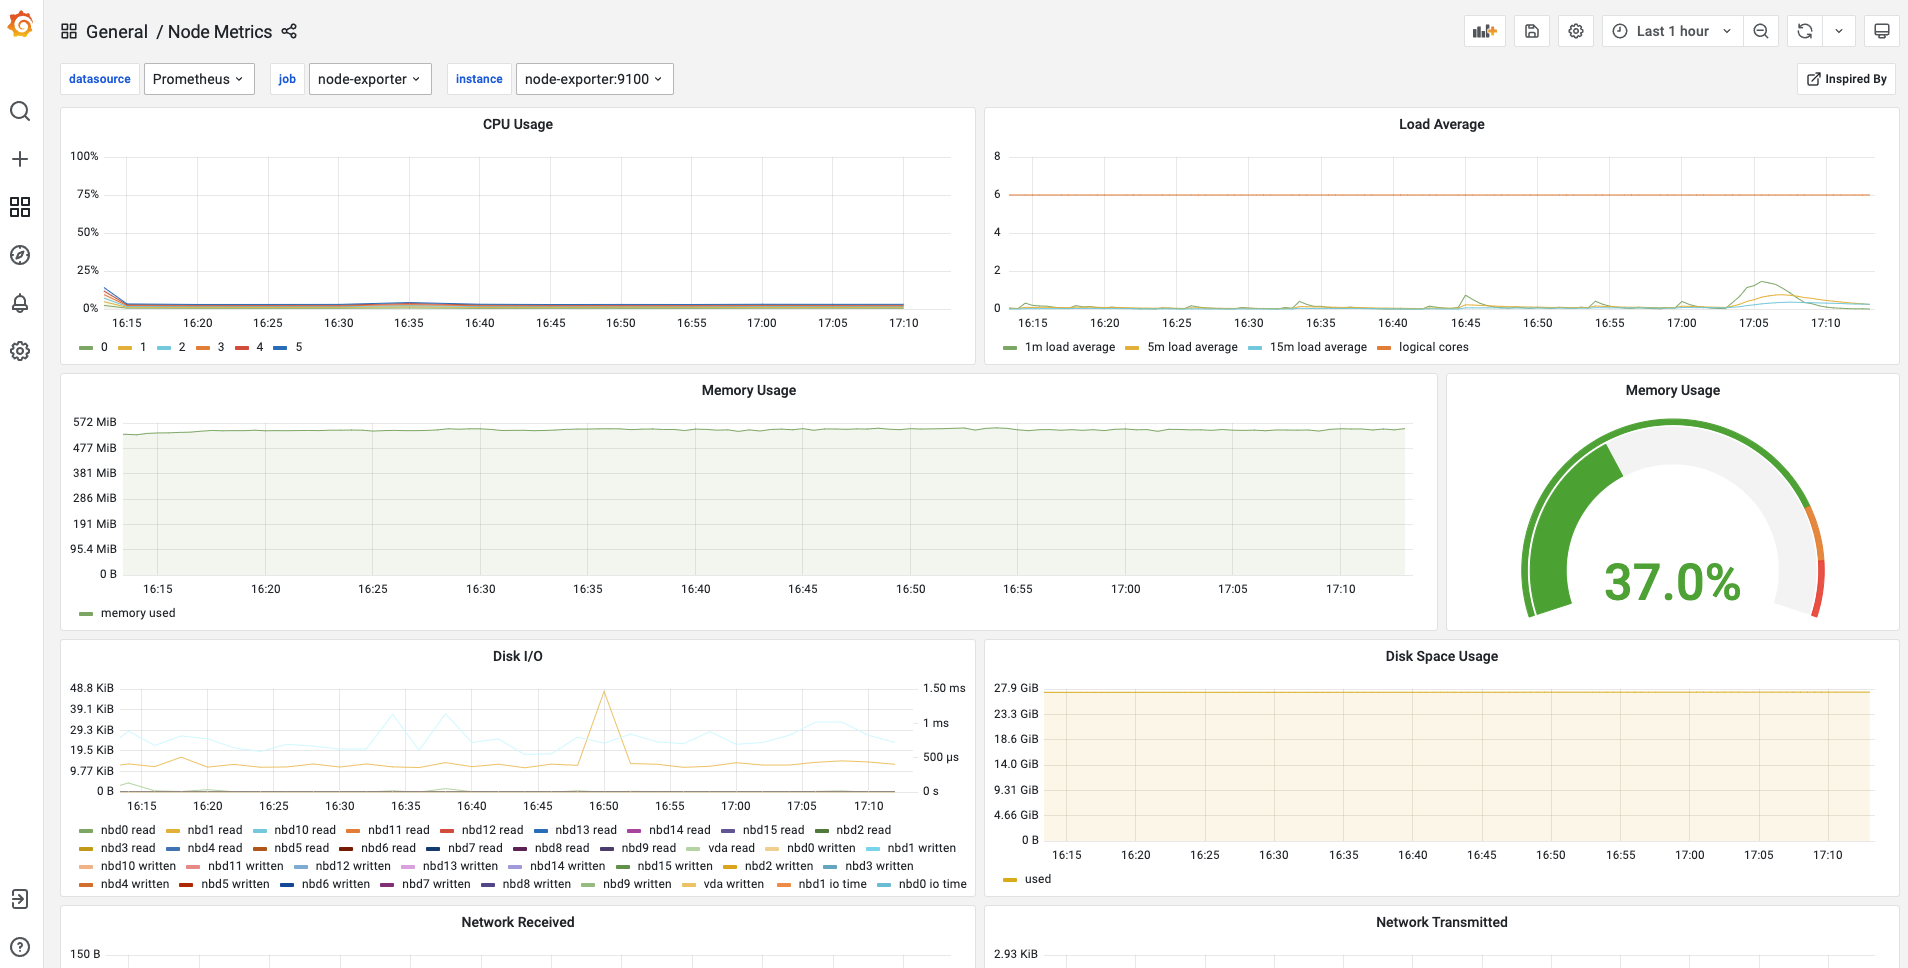
Once you select the Node Metrics dashboard, it should look something like this:
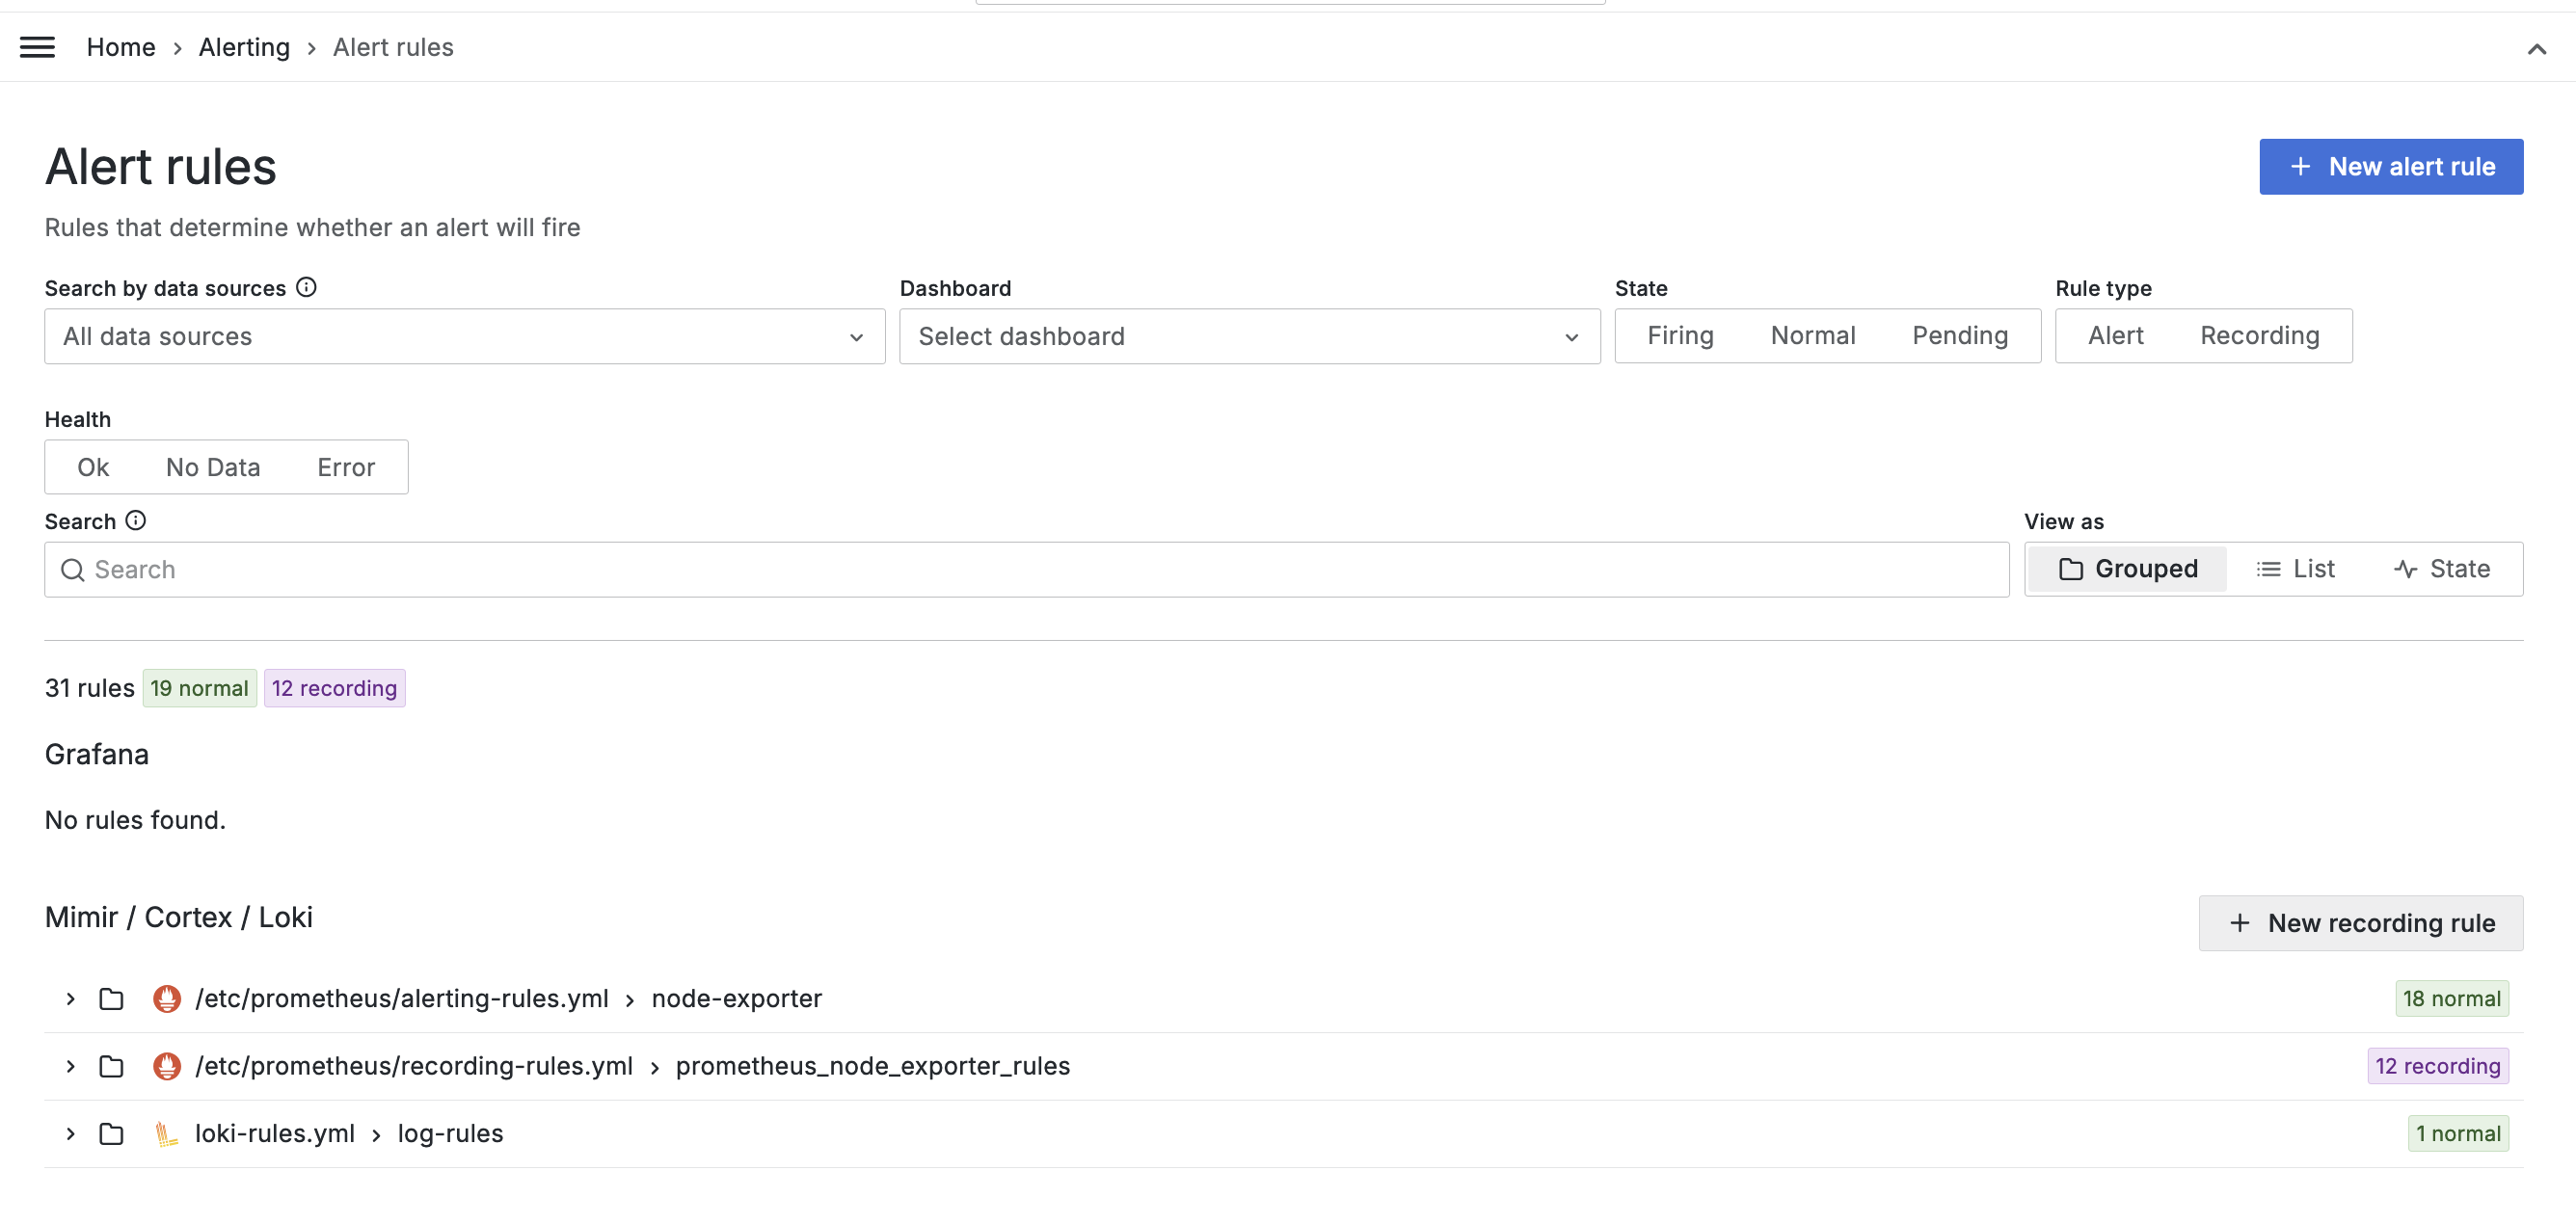
When you select "Alerting" and "Alert rules" you will find the recording and alerting rules:
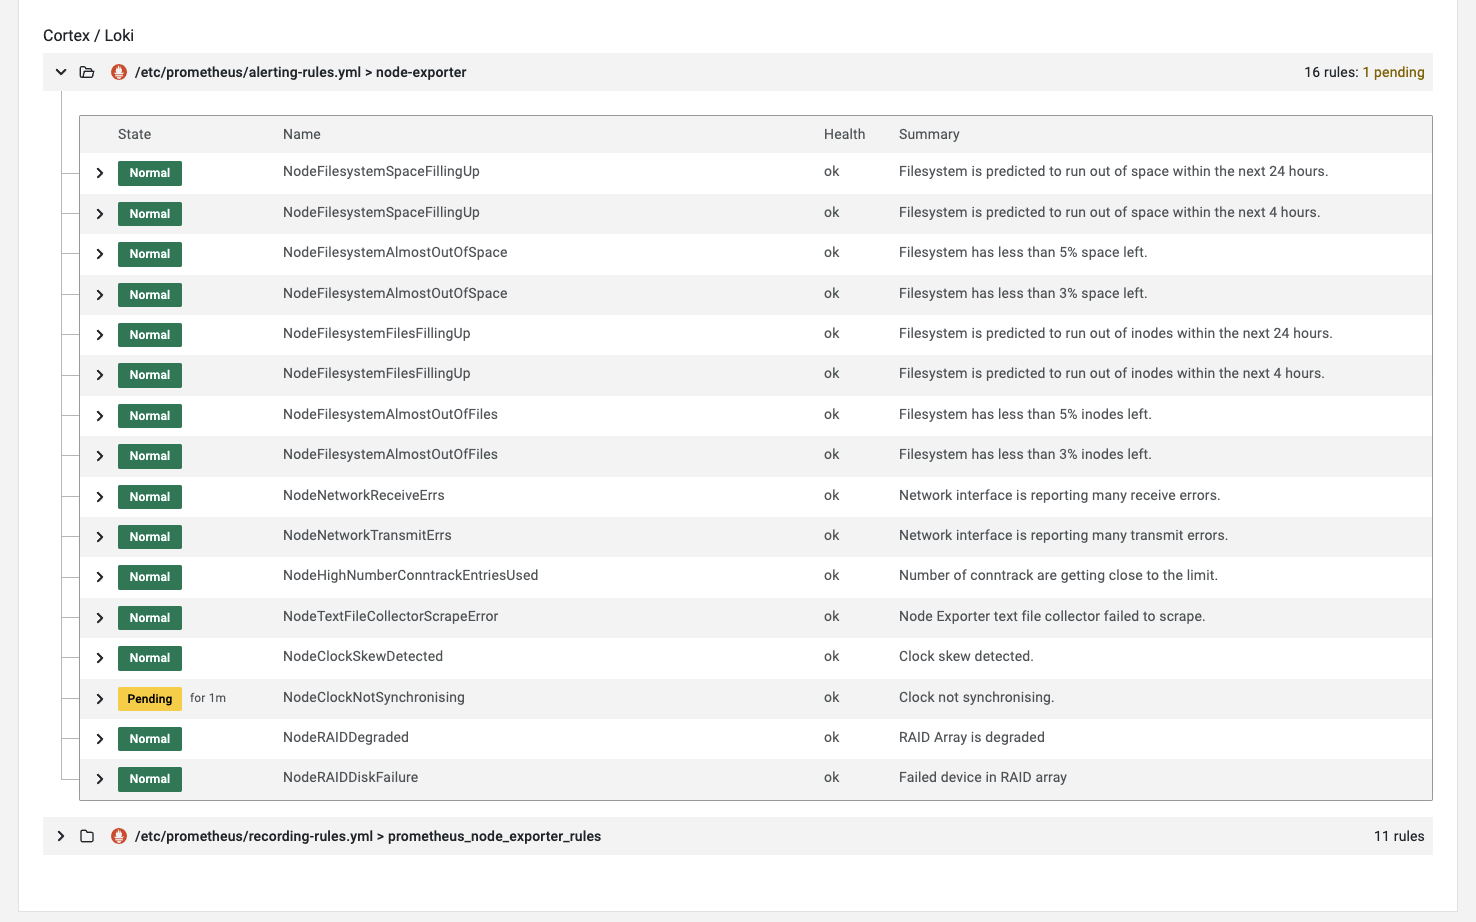
We can expand the alerting rules:
And then we can view more detail on a alert rule:
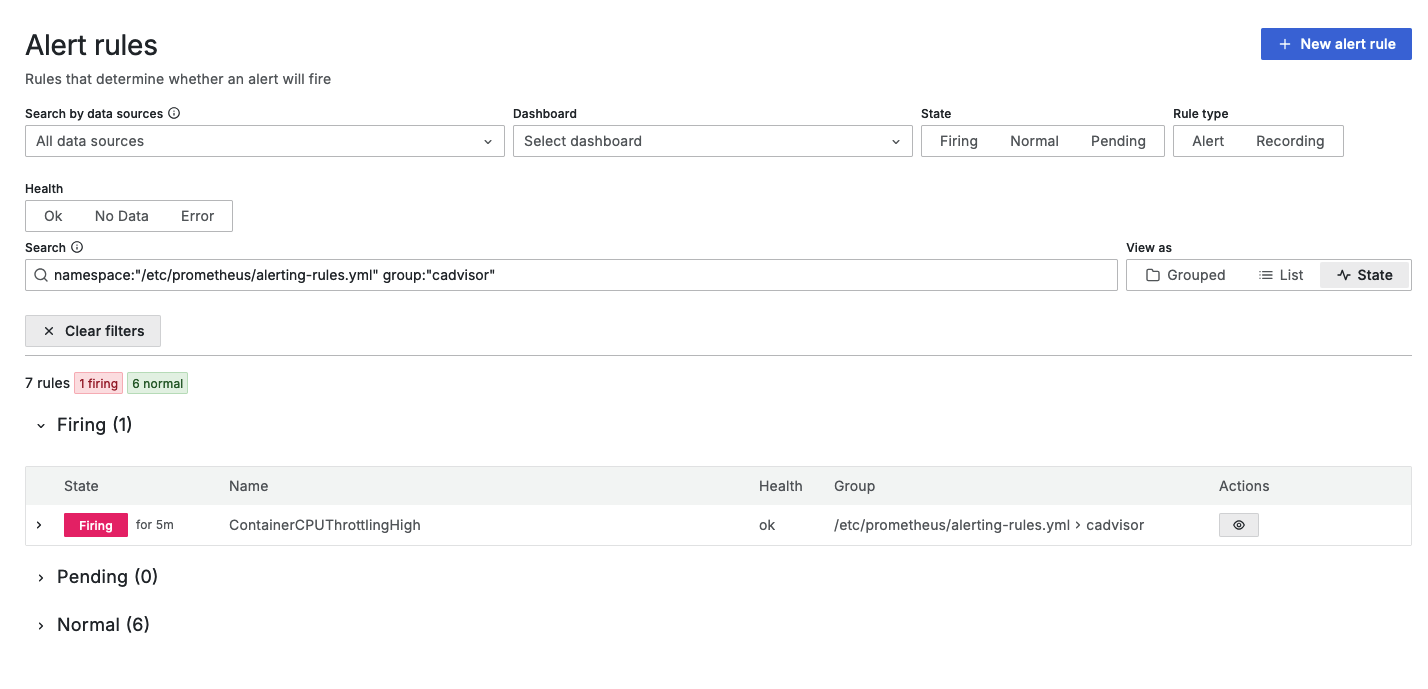
When we see one of our alerts are in an alert state:
We will see them be displayed in Uncomplicated Alert Receiver:
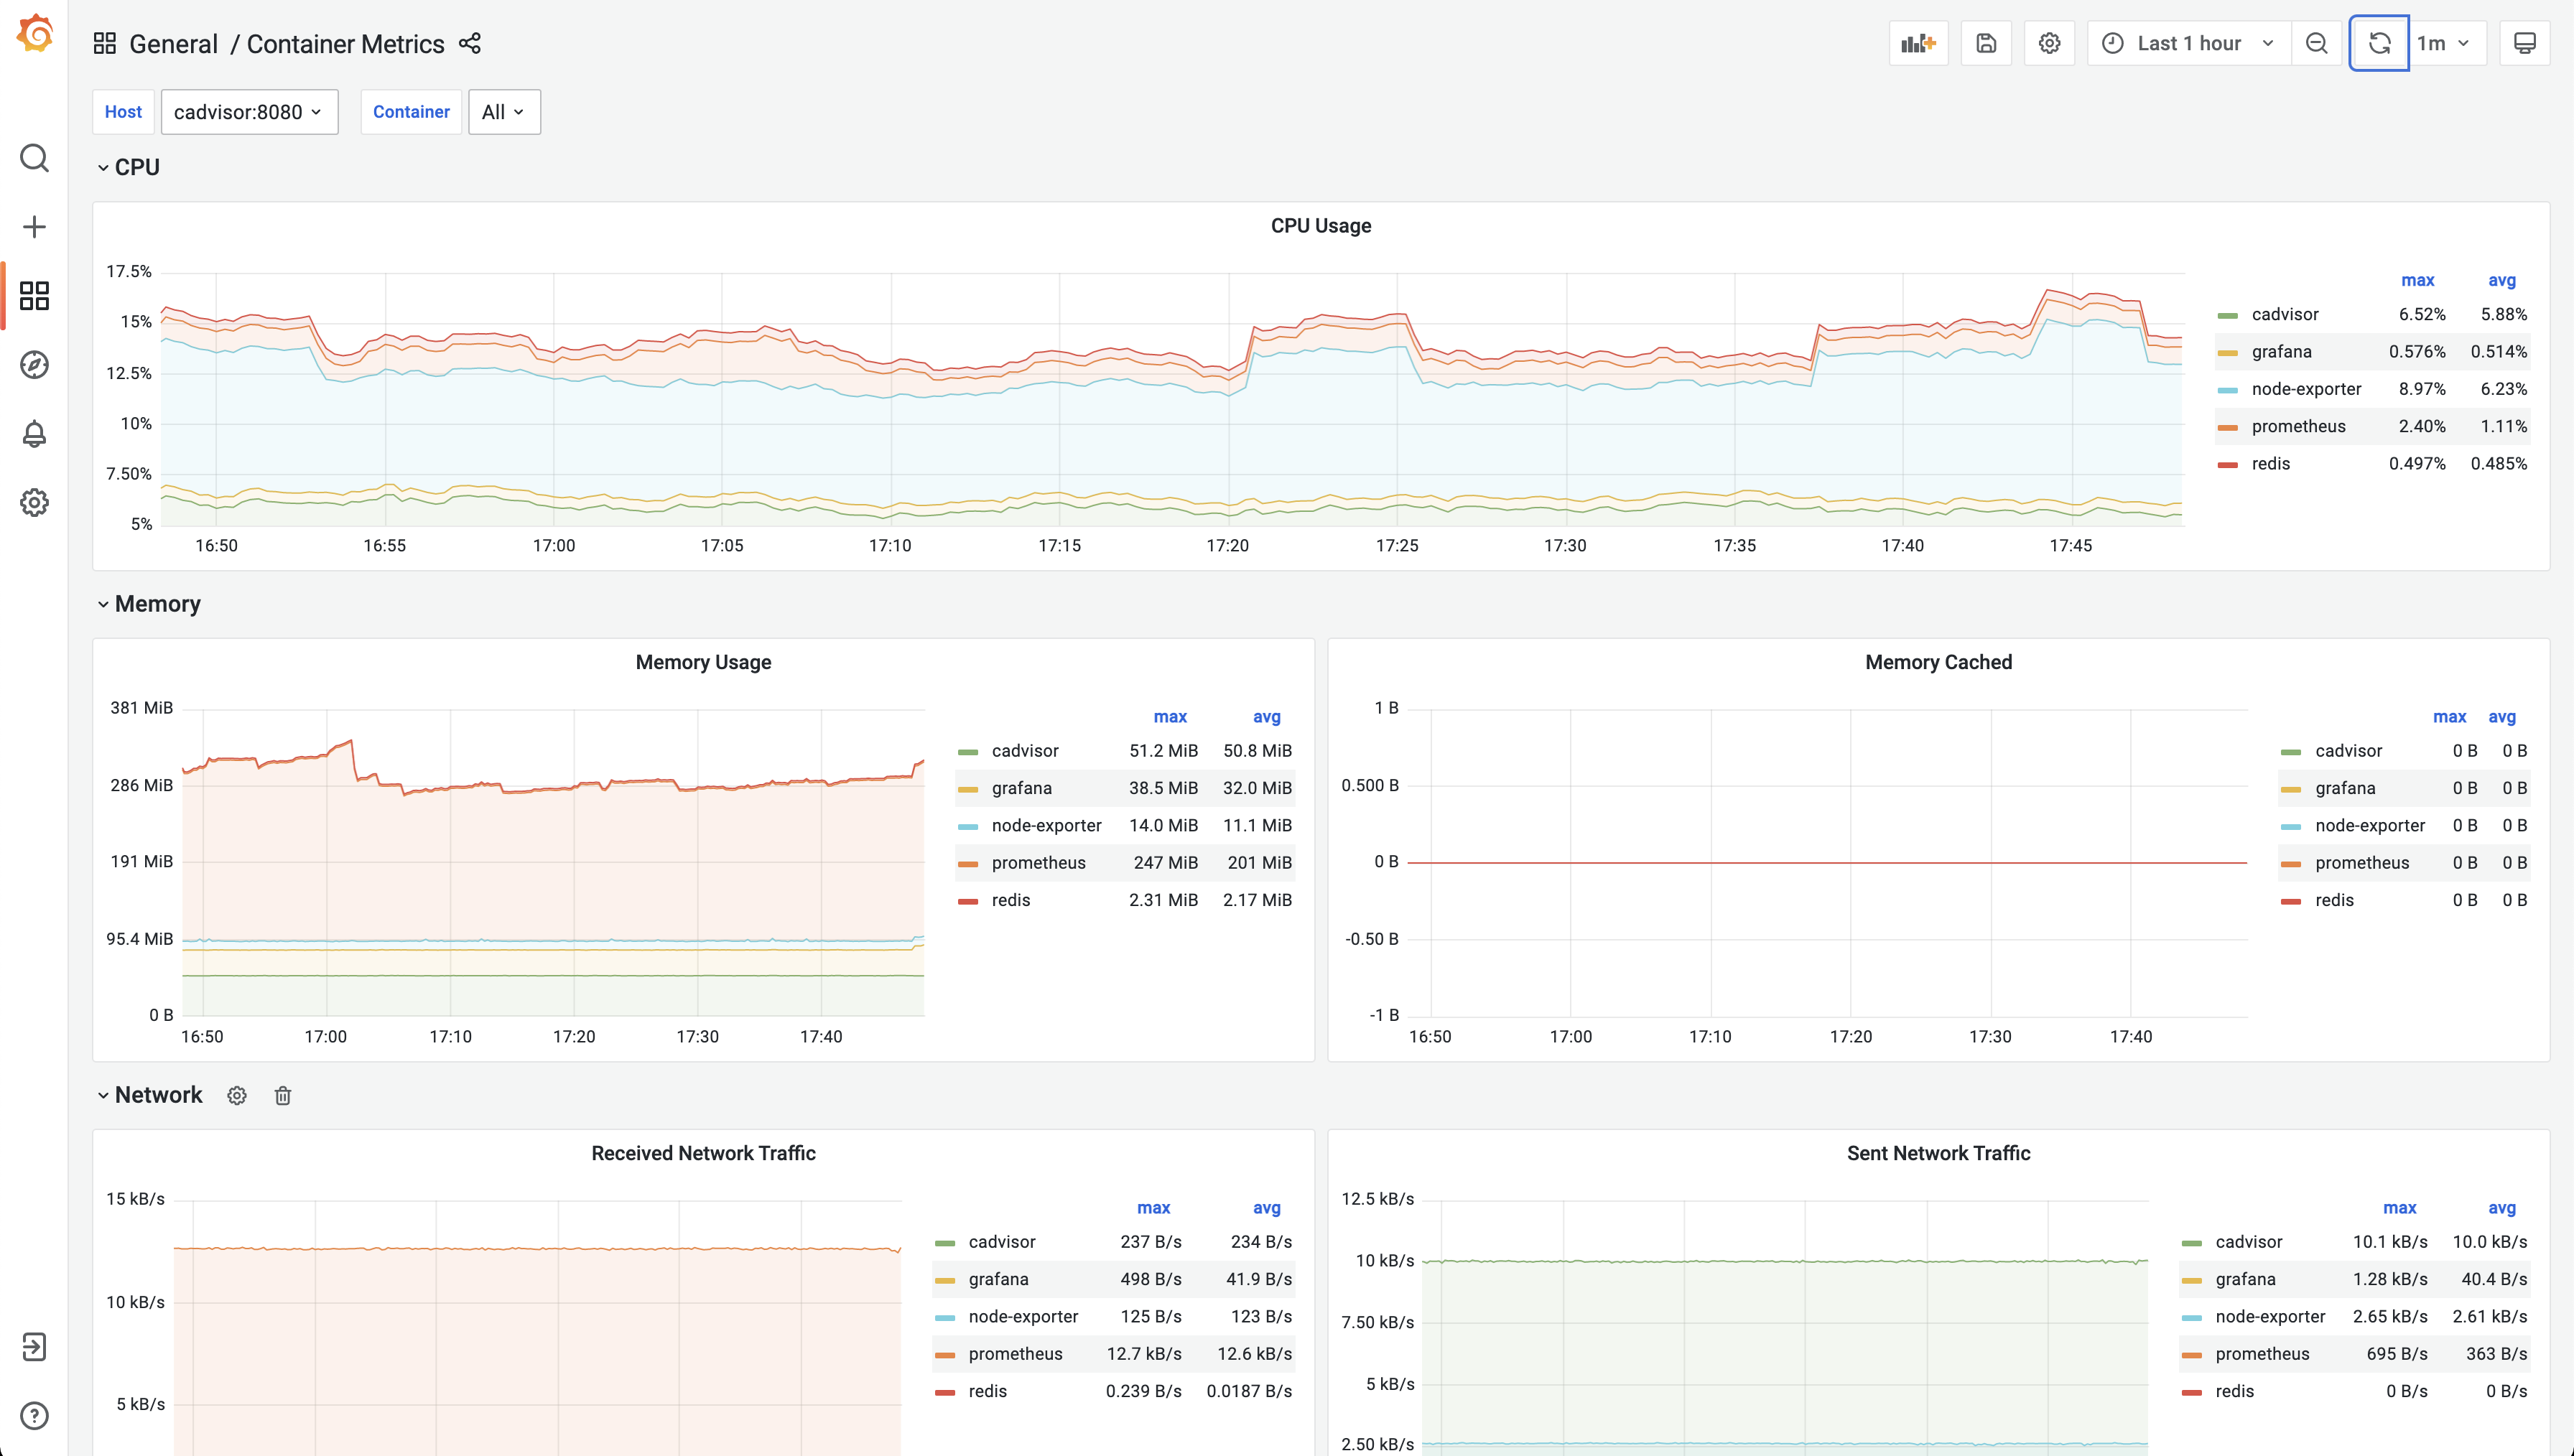
And for our container metrics we can access the Container Metrics dashboard:
Then for our last dashboard, the Container Log Search, by default the metric panel will be collapsed, but to expand it for visibility it will look like this:
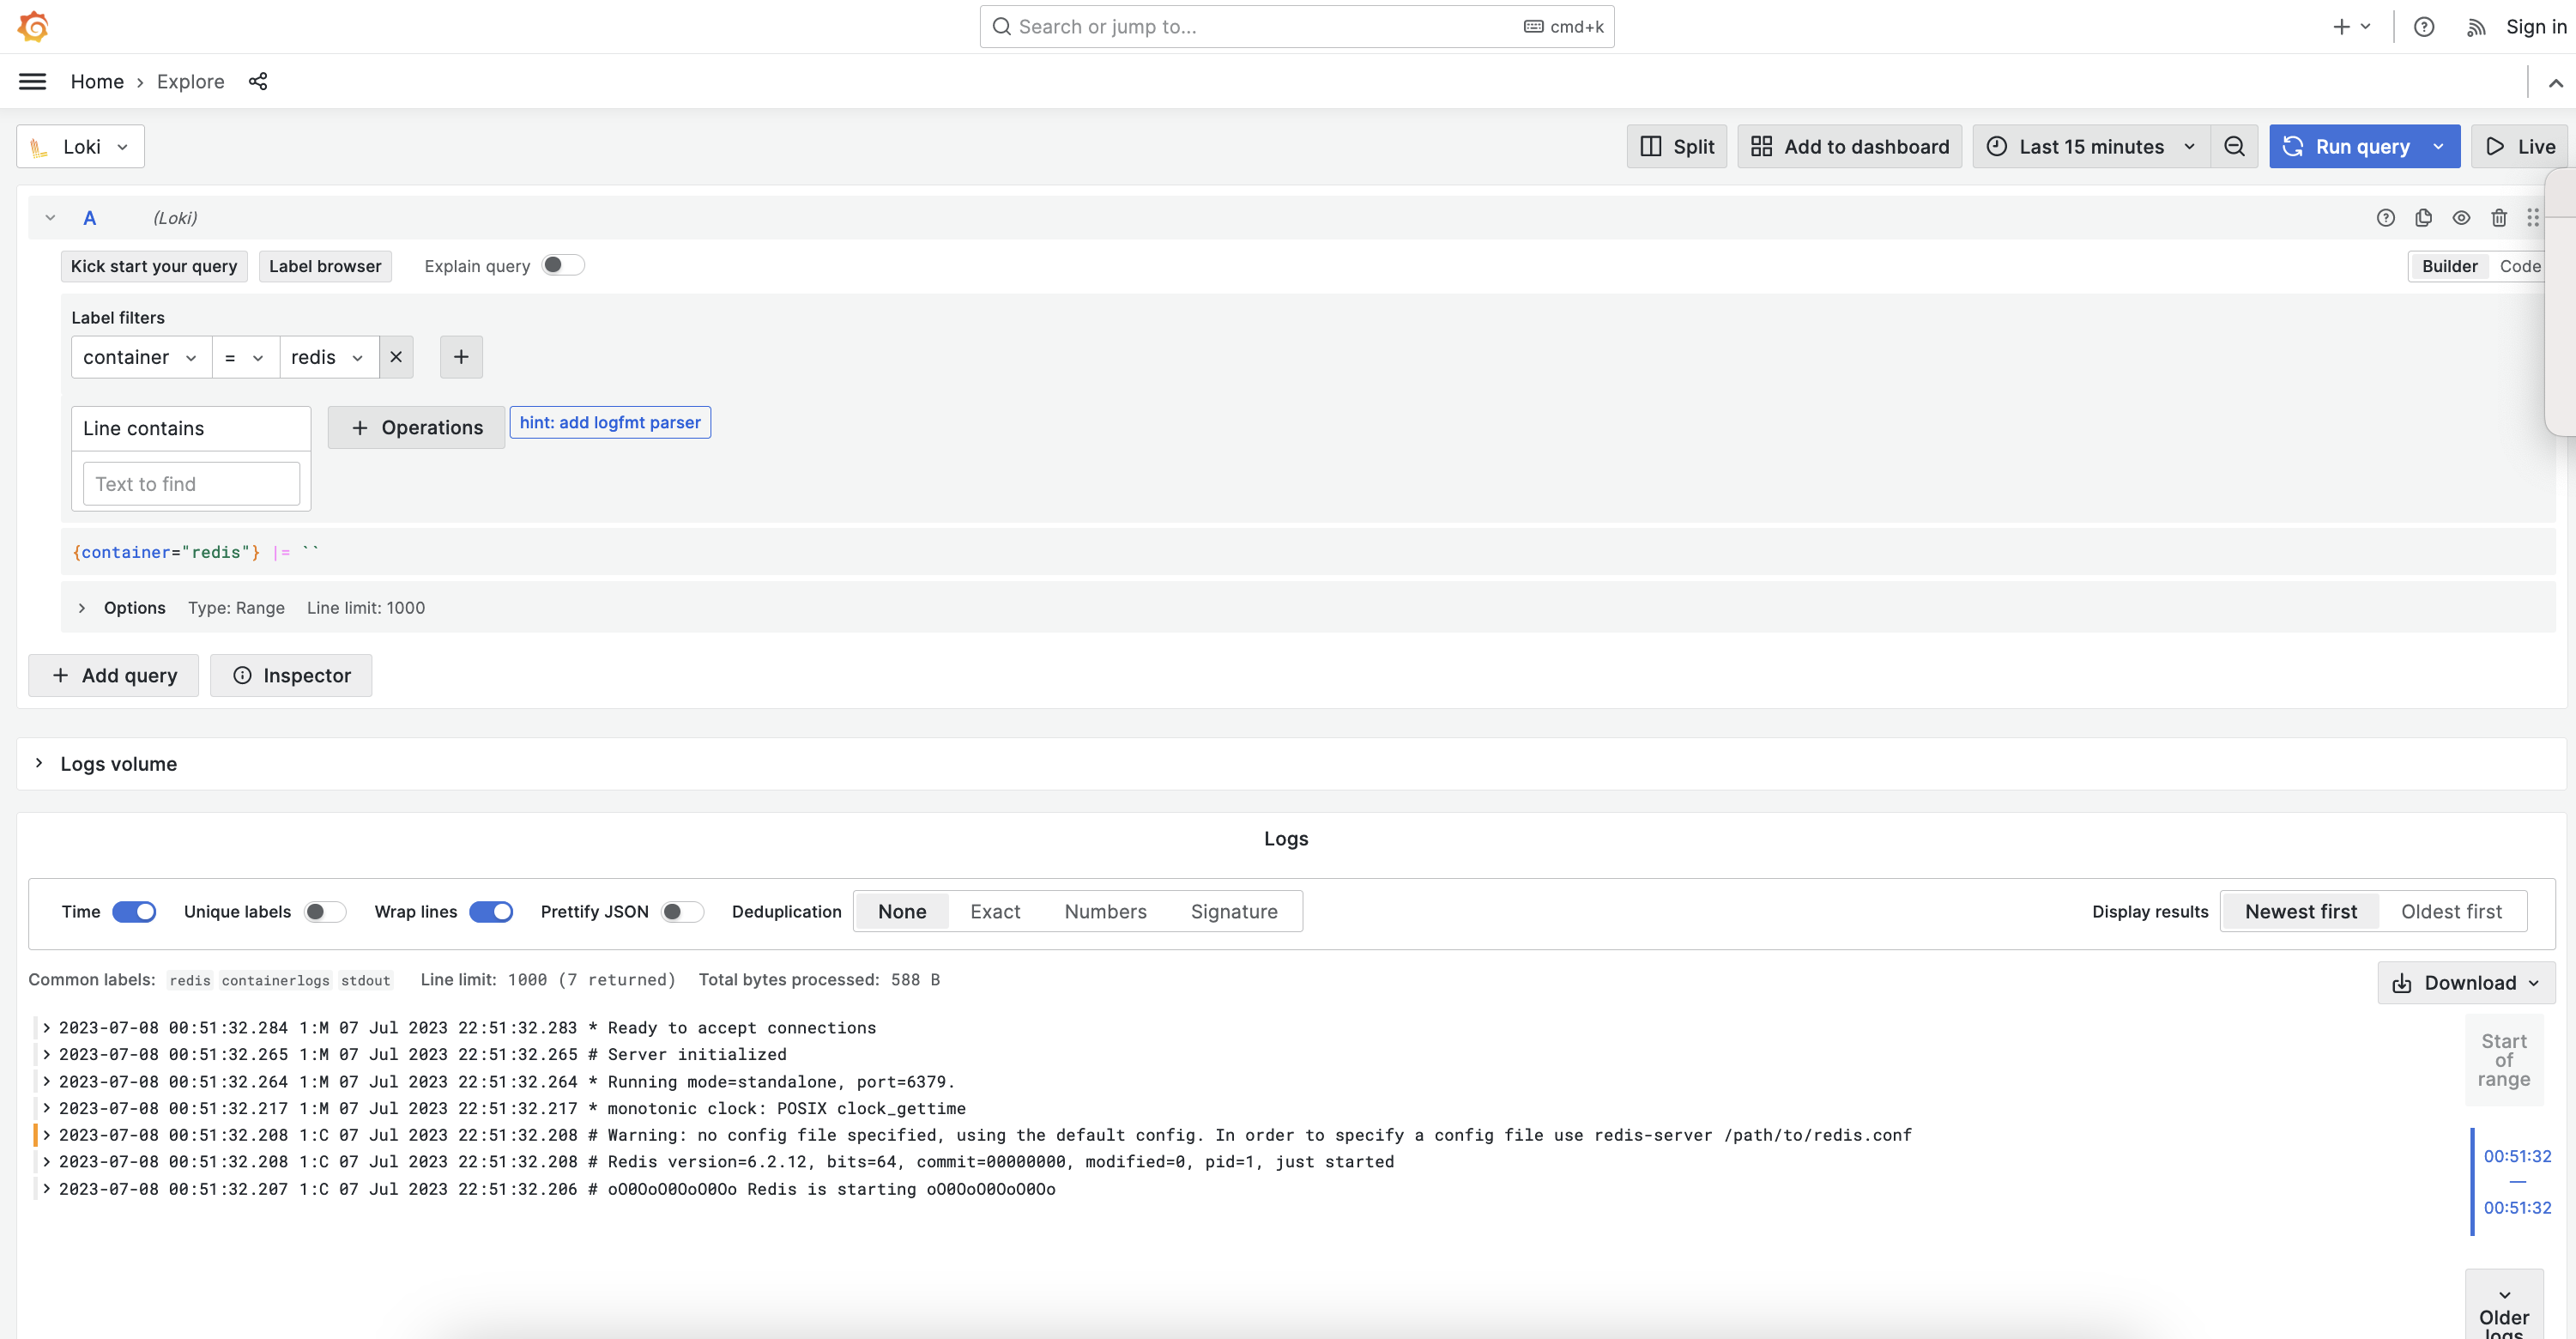
And we can also view our Container Logs in the explore section:
For discovering the Logs we can navigate to the Explore / Logs view:
The following endpoints are available:
| Container | Internal Endpoint | External Endpoint |
|---|---|---|
| Grafana | http://grafana:3000 | http://localhost:3000 |
| Prometheus | http://prometheus:9090 | http://localhost:9090 |
| Node-Exporter | http://node-exporter:9100 | http://localhost:9100 |
| cAdvisor | http://cadvisor:8080 | N/A |
| Alertmanager | http://alertmanager:9093 | http://localhost:9093 |
| Uncomplicated Alert Receiver | http://uncomplicated-alert-receiver:9094 | http://localhost:9094 |
| Loki | http://loki:3100 | http://localhost:3100 |
To remove the containers using docker compose (or make clean):
docker-compose downHeavily inspired from this exporter guide

