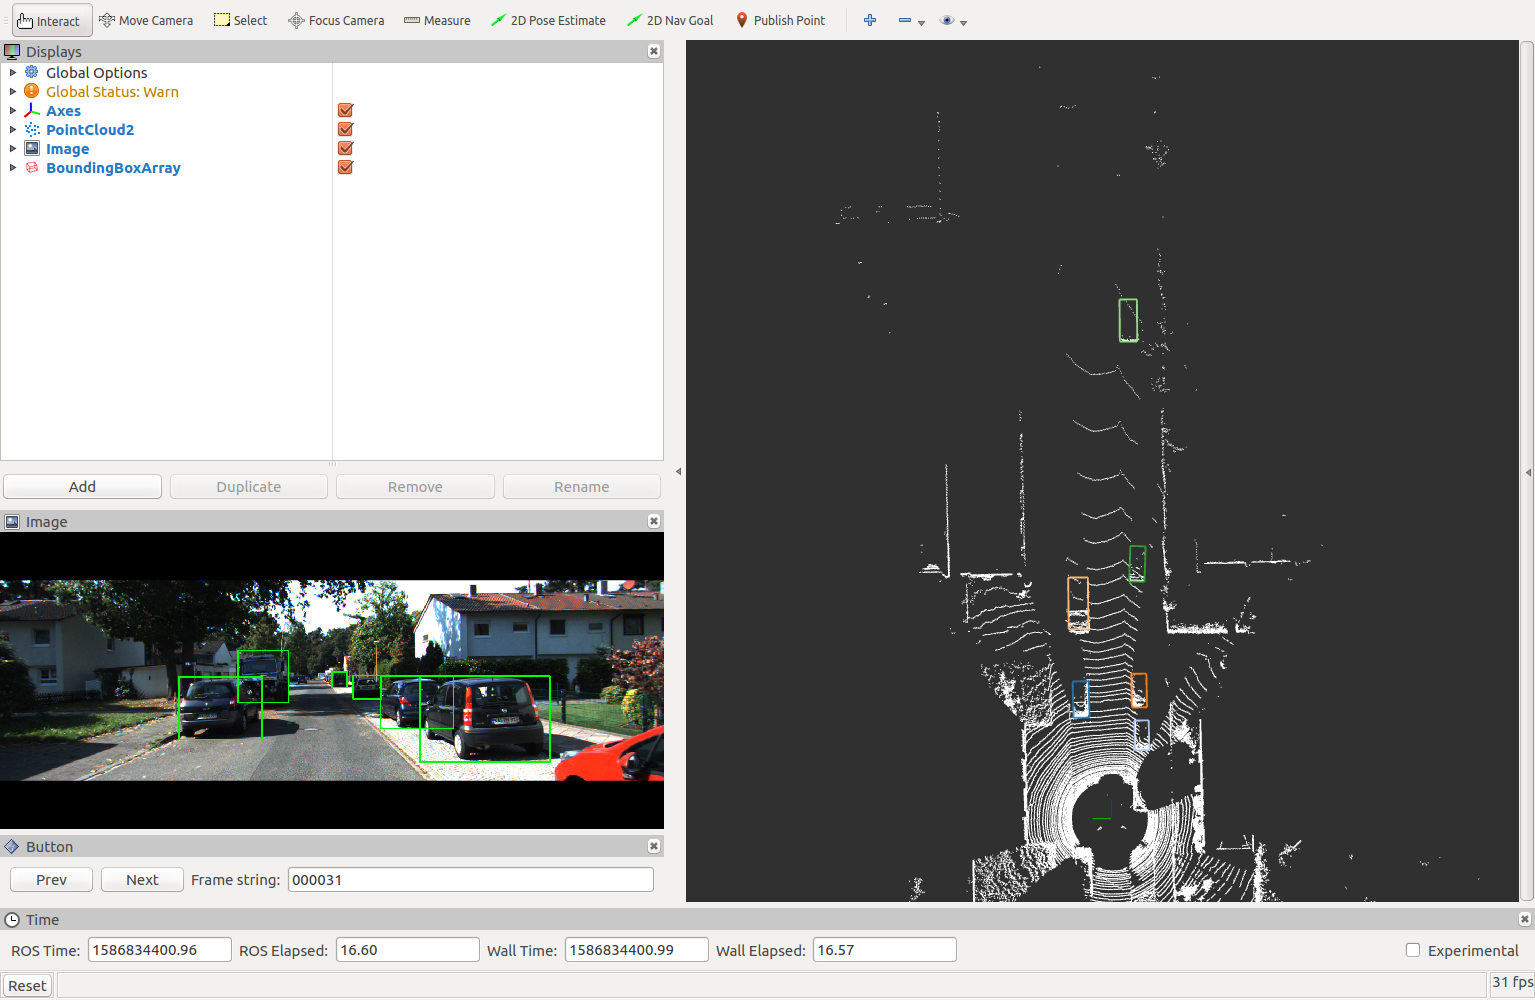
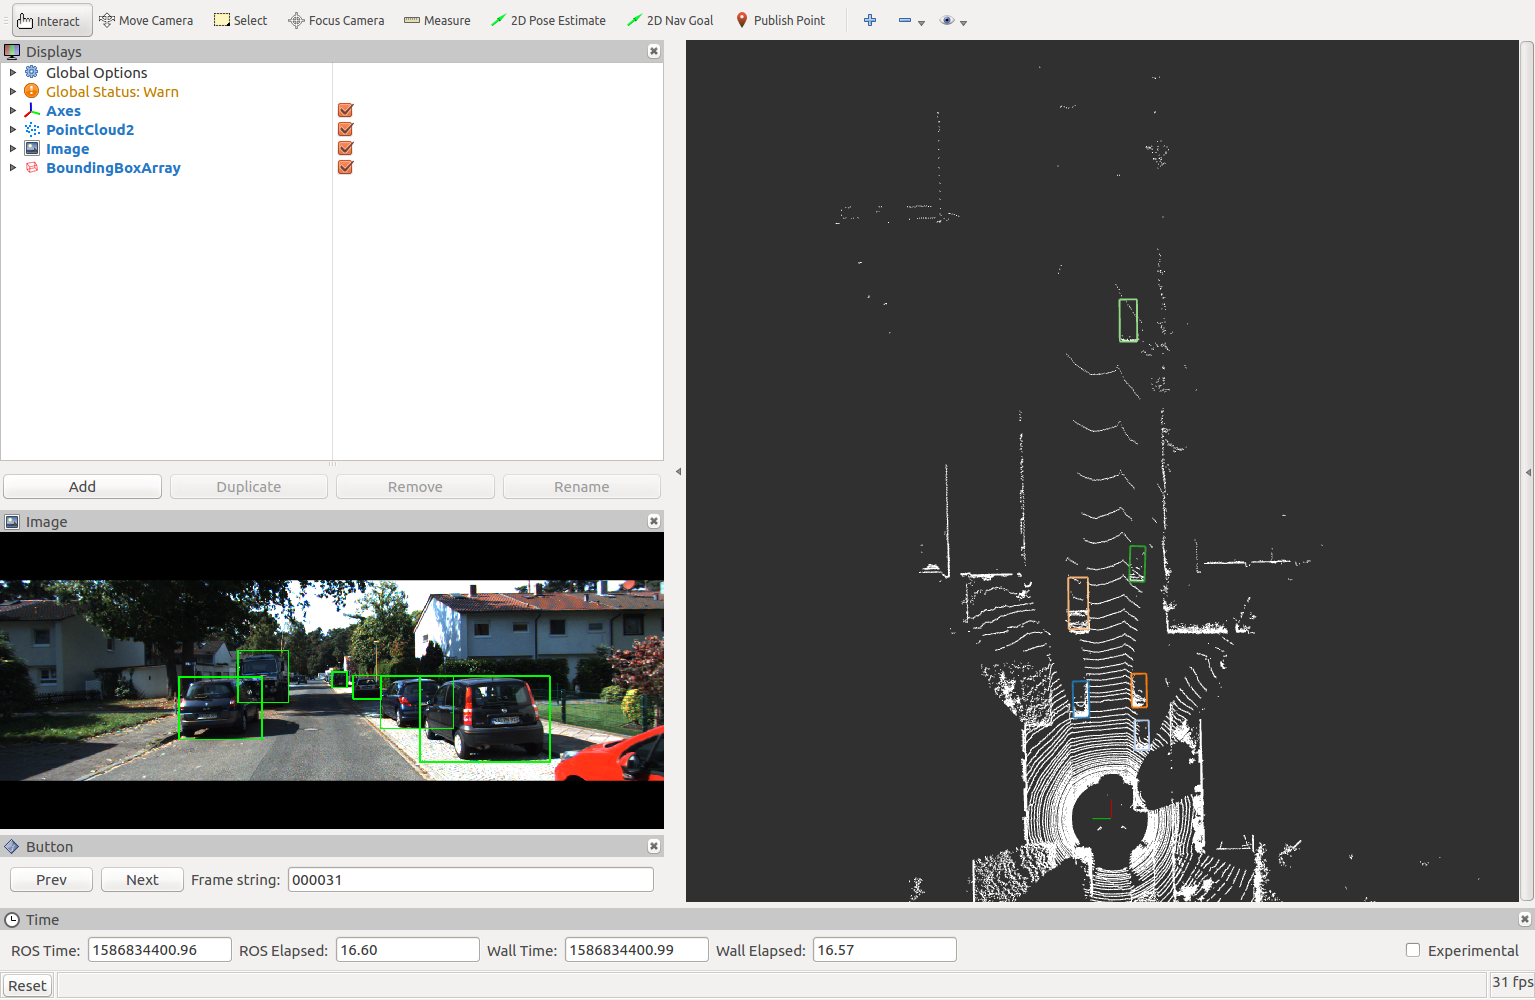
This package is used to visualize kitti data using ROS and Rviz. So far, there has the following main features
- Visualize object data
- Visualize track data
- Visualize road data
- Visualize raw data
All procedures are based on ROS, which is commonly use in robotics and self-driving cars. We tested this package on the Kinetic version, but we believe that it can be used on other versions as well.
This is required for visualizing 3D bounding boxes of objects.
sudo apt-get install ros-kinetic-jsk-recognition-msgs
sudo apt-get install ros-kinetic-jsk-rviz-pluginscd ros_workspace/src
git clone git@github.com:xiaoliangabc/kitti_visualizer.git
cd ros_workspace
catkin_make
source devel/setup.bashDownload object data (velodyne, image_2, calib, label_2) from KITTI Object Detection Dataset and set the folder structure as following:
object
    testing
        calib
        image_2
        results
        velodyne
    training
        calib
        image_2
        label_2
        velodyne
Open launch/object_visualizer.launch file, change the following configs:
data_path: folder that contains object datadataset: which dataset want to visualize (training/testing)frame_size: number of frames for the corresponding dataset (training: 7481/tesing: 7518)current_frame: frame index want to start visualization
Run
roslaunch kitti_visualizer object_visualizer.launch
Then Rviz will be launched, the layout of Rviz is look like
Move the mouse to the bottom left of the screen:
- Click the Prev button: switch to the previous frame
- Click the Next button: switch to the next frame
- Type frame number to Frame string box: jump to the frame you specified
Download track data (velodyne, image_2, calib, label_2) from KITTI Object Tracking Dataset and set the folder structure as following:
tracking
    testing
        calib
        image_02
        results
        velodyne
        oxts
    training
        calib
        image_02
        label_02
        velodyne
        oxts
Open launch/track_visualizer.launch file, change the following configs:
data_path: folder that contains track datadataset: which dataset want to visualize (training/testing)scene: which scene want to visualize (00xx)current_frame: frame index want to start visualization
Run
roslaunch kitti_visualizer track_visualizer.launch
Then Rviz will be launched, the layout of Rviz is look like

