- Background
- Motivation
- Wrangling Customer Data
- Processing & Analyzing the Data
- Model Selection
- Train & Evaluate Models
- HyperParameter Tuning
- Predictions
- CBCV Calculations
- Valuation Comparisons
- Opportunites going forward
- Lessons Learned
- Appendices
- Additional Imagery
- Works cited
Company valuation traditionally has been calculated two ways
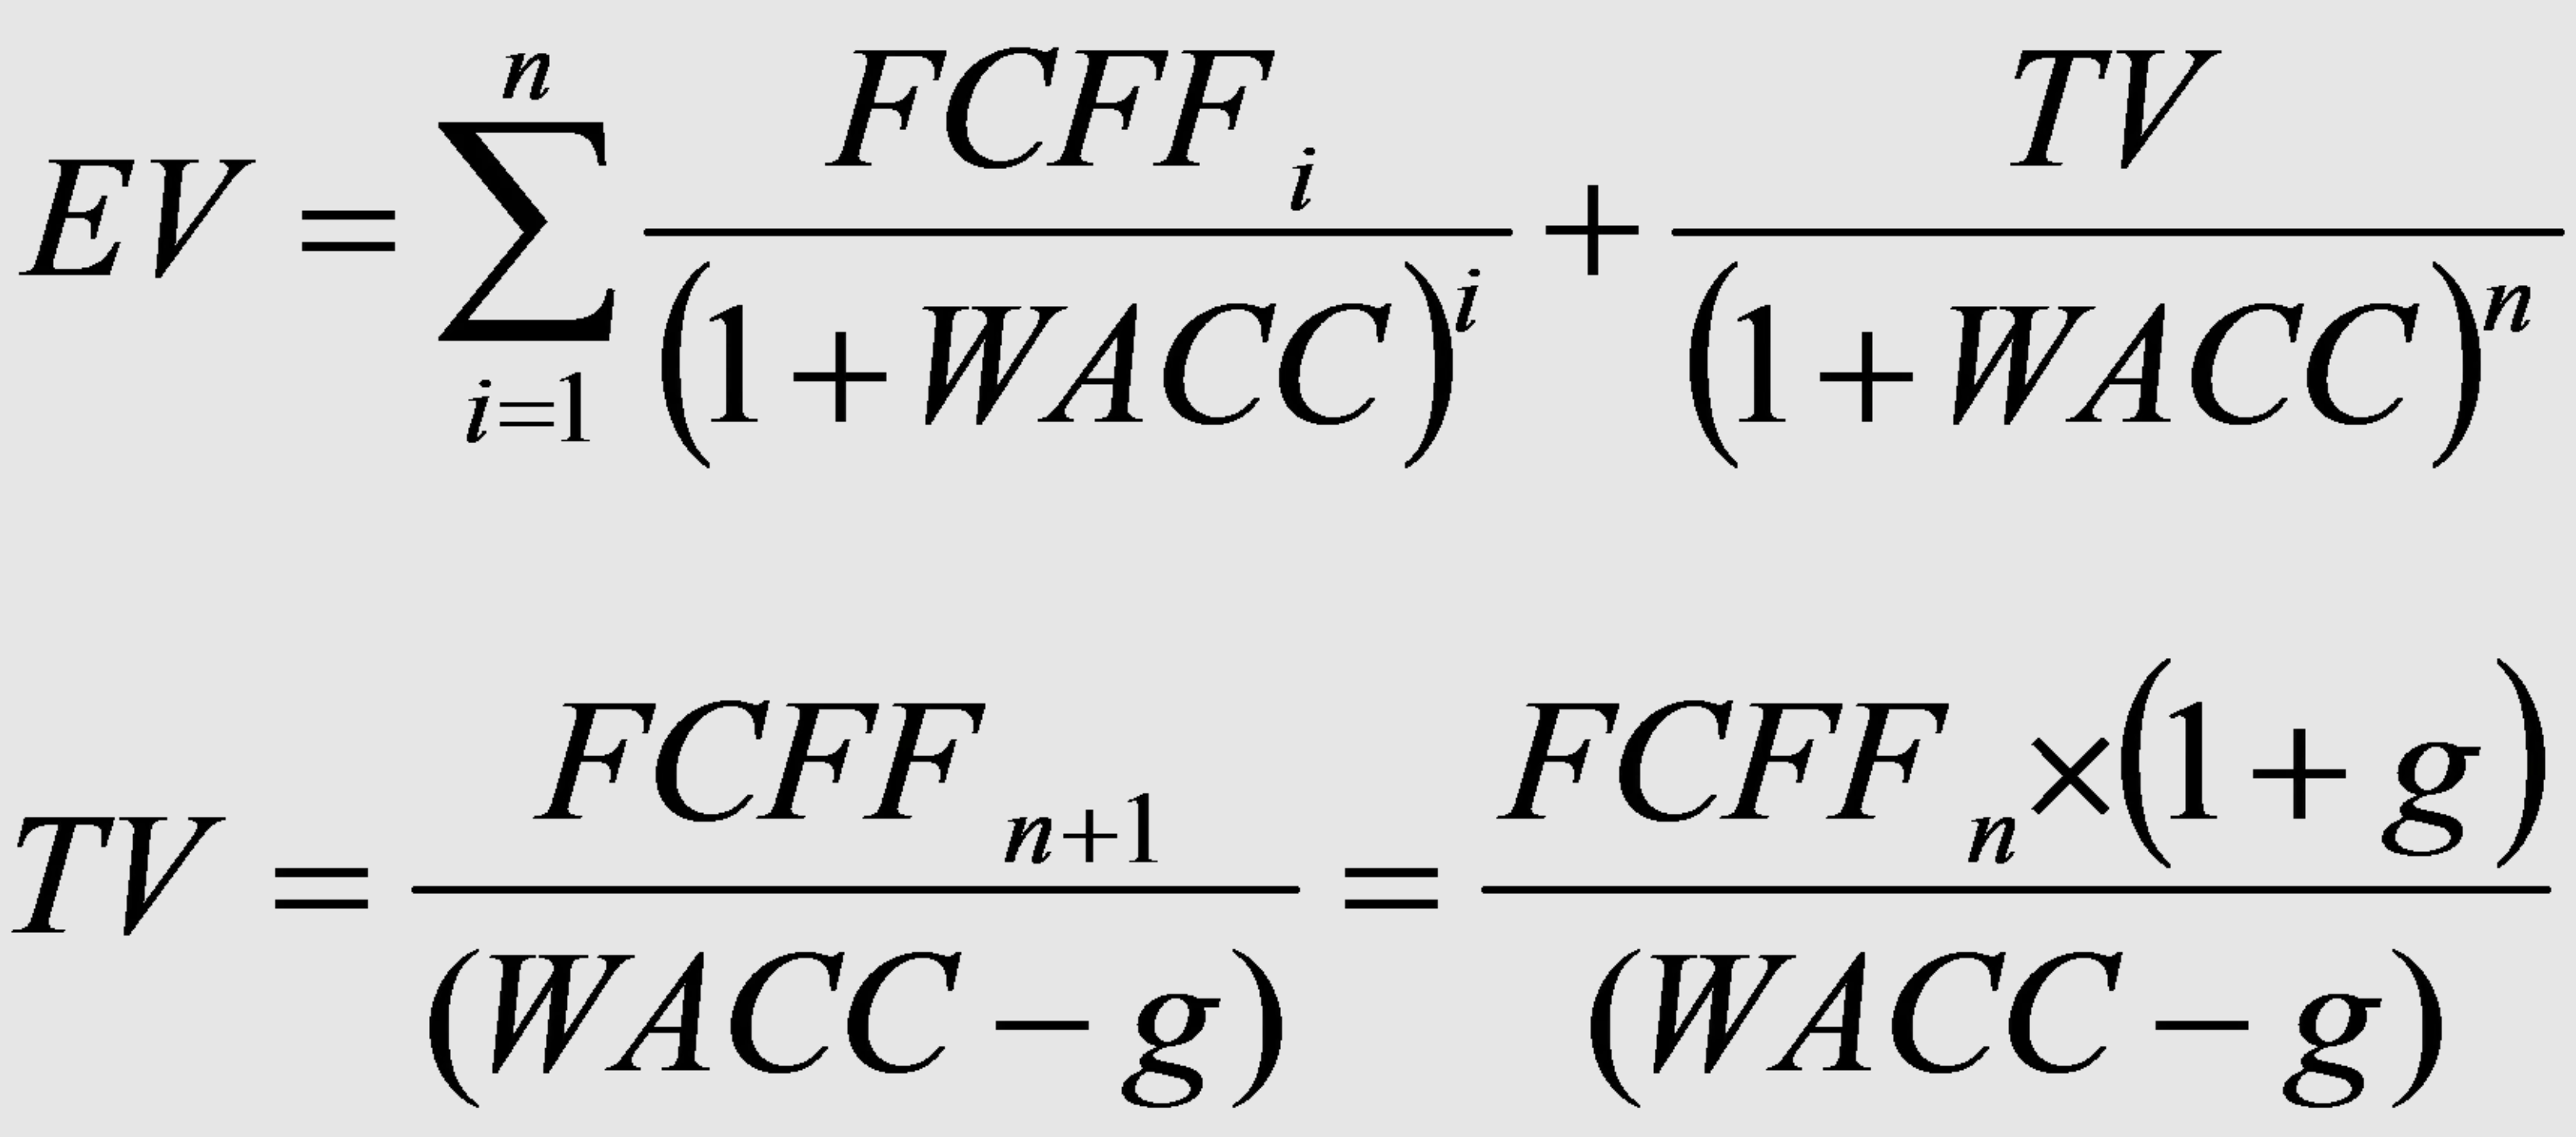
- Discounted Cash Flow (DCF): a frequentist approach to project historical revenues, growth and cashflow numbers forward then discounting them for todays value of money.
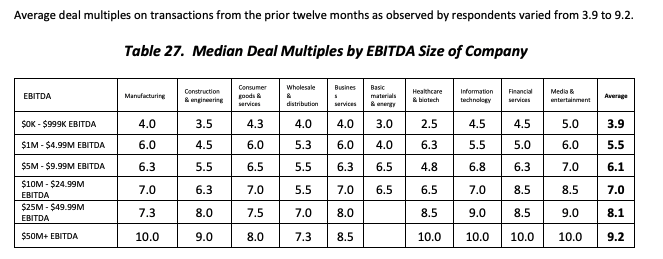
- Market Multiple: similar to pricing a home:
- Home Price = Total SQFT * $ per SQFT from comparable homes that recently sold or are on the market
- Company Valuation = EBITDA * Market Multiple
- See "Median Deal Multiples from Pepperdine's 2020 Middle Market report:
Now With data science we can better predict revenues, growth and cashflows by segmenting customers into cohorts to:
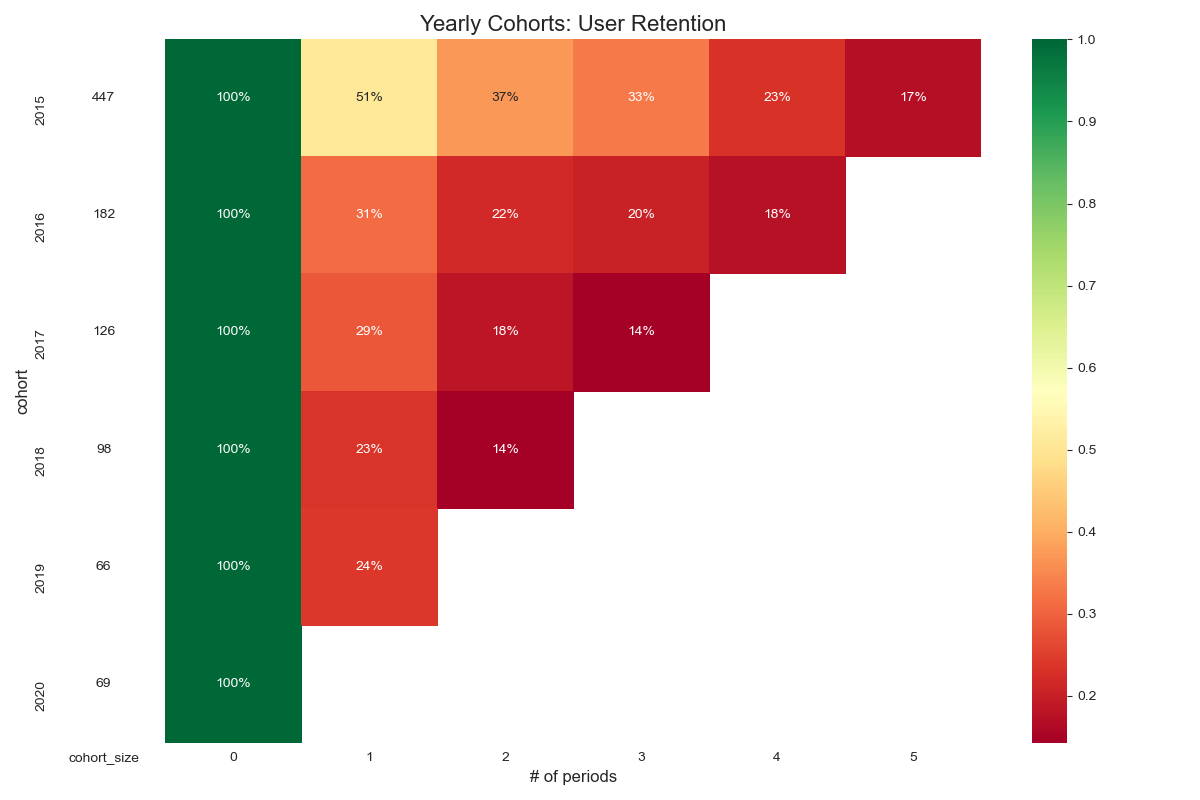
- Model churn and retention rates for each cohort
- Model expected future amount of transactions
- Model expected average sales per transaction
- Model number of new customers per year
- Calculate average profit margin per customer
- Calculate cash flows from customers aka Customer Life Time Values (CLTV)
- Calculate sum of CLTVs by period cohorts to provide Future Cash Flows that can be discounted to todays value
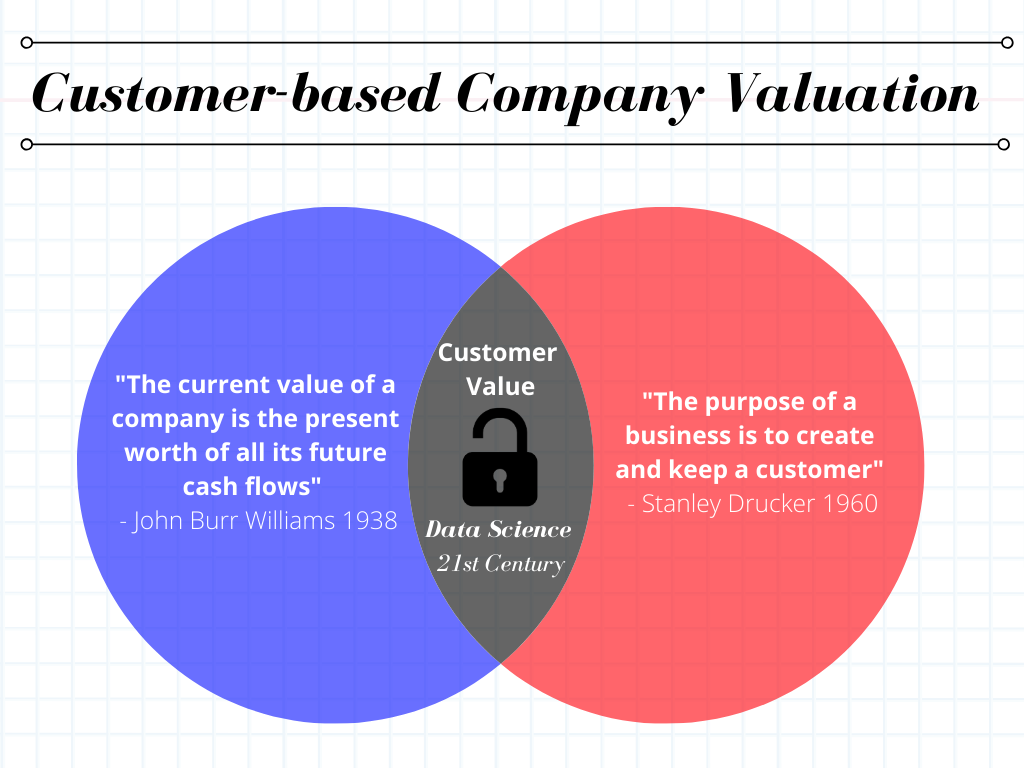
This advanced analytics approach is called Customer-Based Corporate Valution (CBCV) trademarked to Theta Equity Partners, https://www.thetaequity.com/.
Curiousness to see how the advanced analytics CBCV compares to DCF or Market Multiple valuation approach for a lower middle market company.
Financial engineering has long been the hallmark of investment firms but with the combination of Data Science and the Customer-Based Corporate Valuation (CBCV) approach they have the ability to add "Customer engineering" as another distinguishable charecteristic.
- CBCV approach focuses on the purpose of business, building and retaining customers
- CBCV approach compared to alternative valuation approaches provides a more useful handover from the deal team to the operations team
- CBCV segmentation can be implemented into Customer Relationship Management (CRM) and marketing tools
- CBCV approach emphasis customer service as the long tail customer provide the most value in terms of customer equity and cashflow
Company: "eChalk" is a supplier and installer of smart school equipment such as "smart boards"
Dataset: 6 years of customer transaction history
Report example:
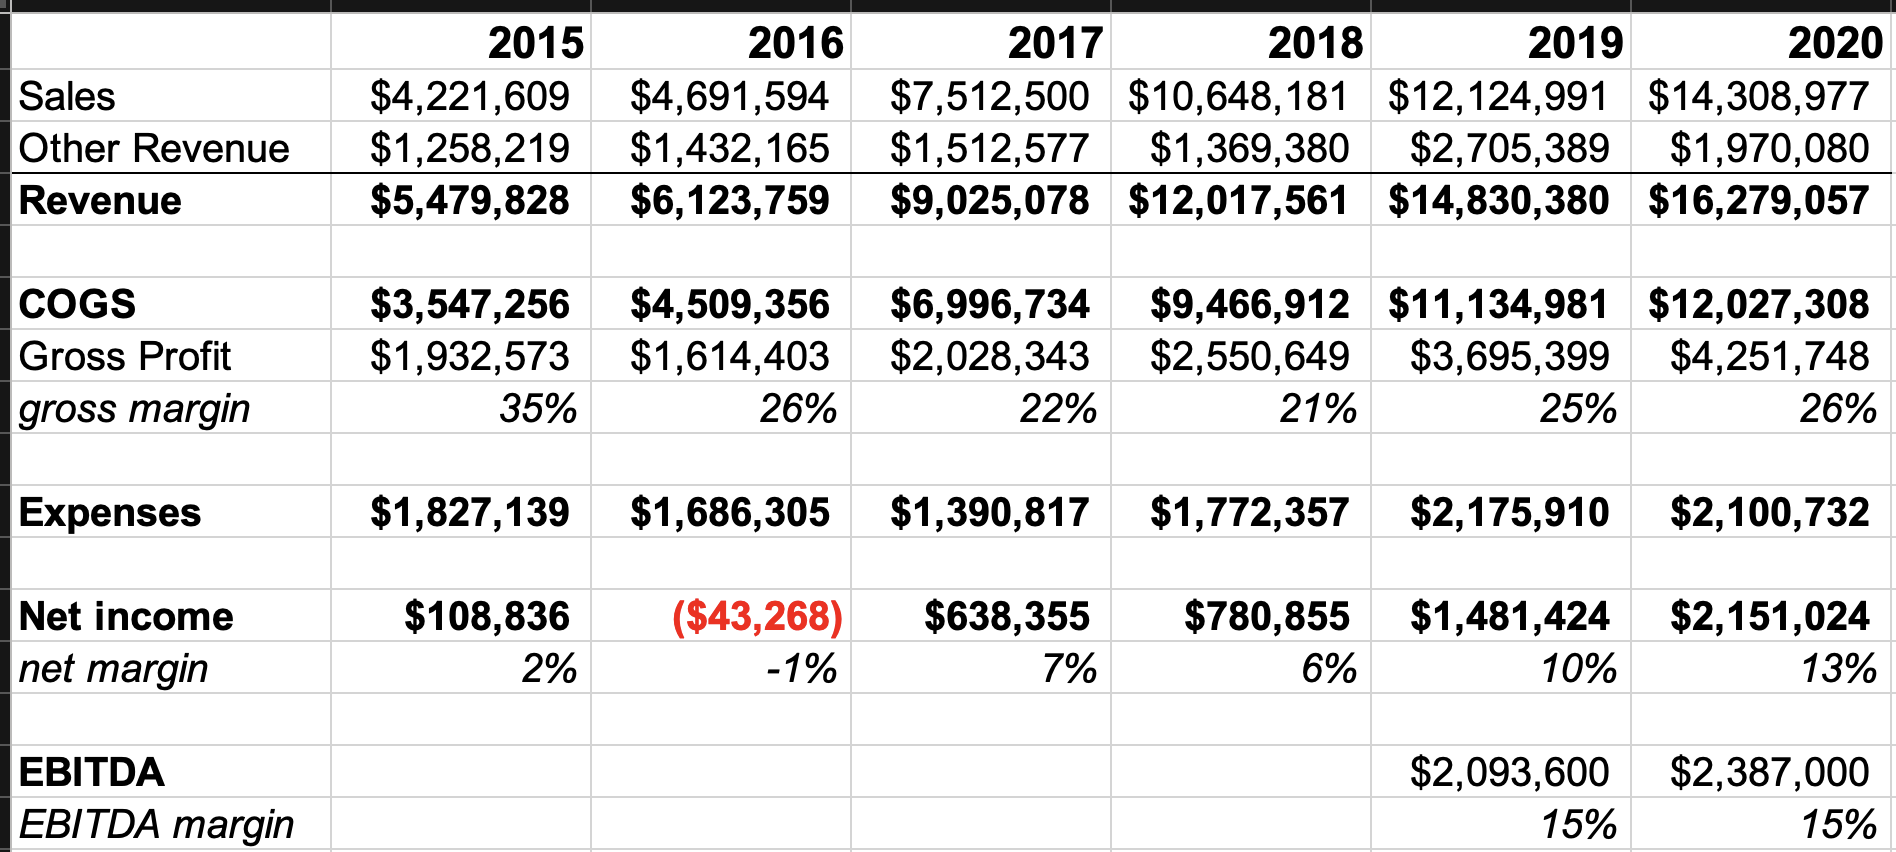
Company Financials:
- $16,279,057 Revenue (trailing twelve months)
- 26% Gross Profit Margin
- $2,387,000 EBTIDA (trailing twelve months)
- 0.25 WACC
- 0.02 Monthly Discount Rate
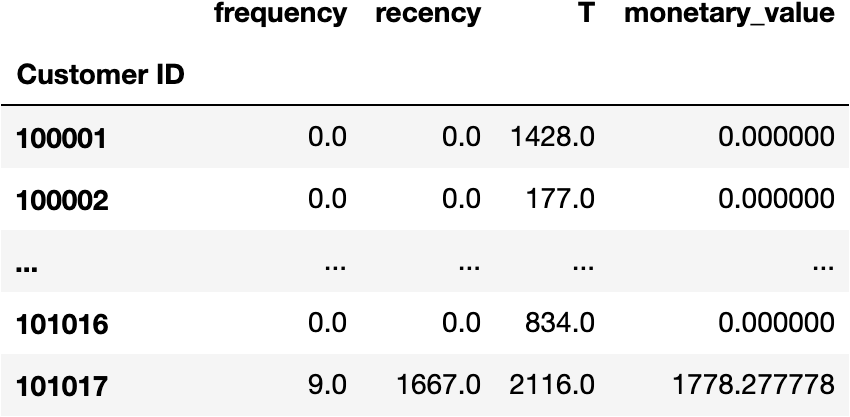
To find CLTV we transform sales data to a RFM dataset:
- Frequency represents the number of repeat purchases the customer has made. This means that it’s one less than the total number of purchases.
- Recency represents the age of the customer when they made their most recent purchases. This is equal to the duration between a customer’s first purchase and their latest purchase. (Thus if they have made only 1 purchase, the recency is 0.)
- T represents the age of the customer in whatever time units chosen (daily, in our dataset). This is equal to the duration between a customer’s first purchase and the end of the period under study.
- Monetary_Value Total amount of Money the Customers has spent
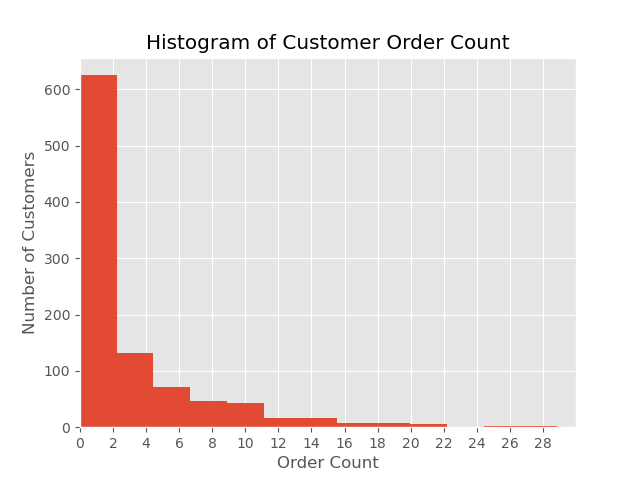
988 unique customers
340 are repeat customers i.e. more than one purchase
34.4% are repeat customers
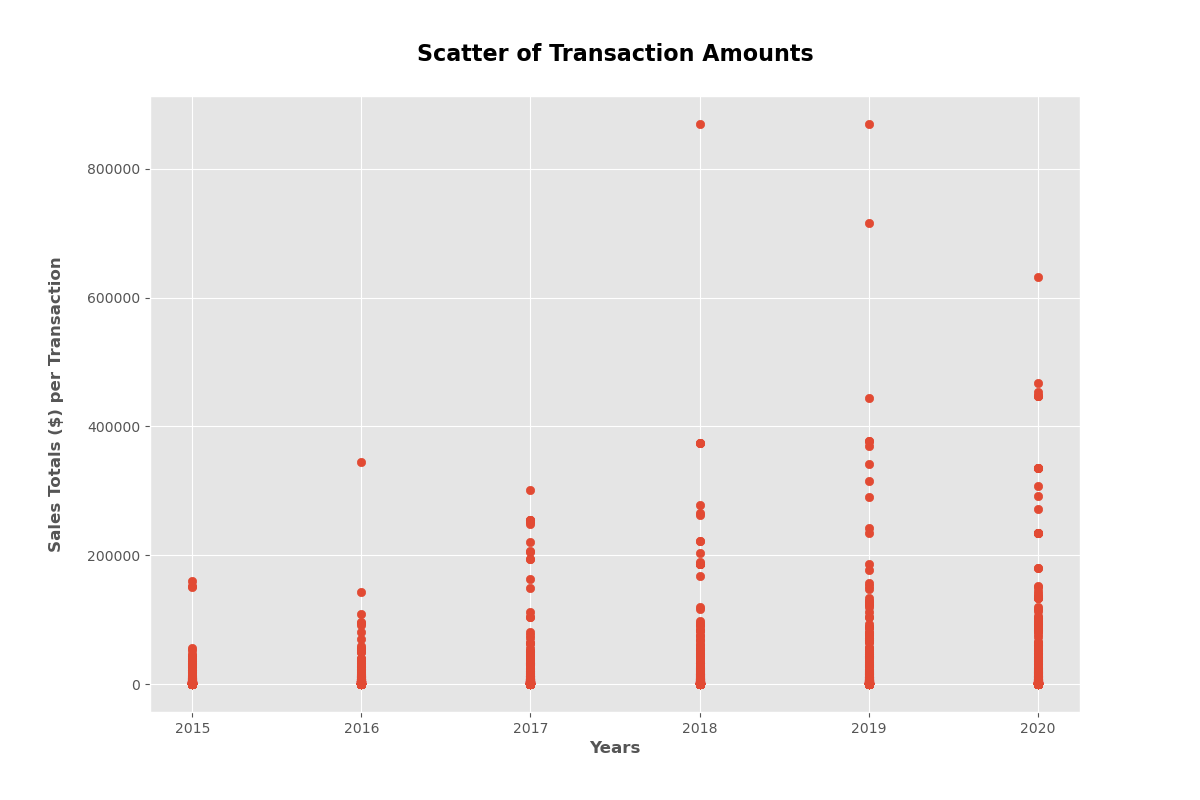
Transactions per year
avg sales per transaction 6 yrs
avg sales per transaction 2020
A) To predict Frequency (Number of Transactions) & Recency (Prob Alive)
B) Predict Monetary Value (Avg Sales per Transaction)
C) A * B = Sales/yr in order to forecast sales
- T = days
- time = year
- any additional
- train on 2015-2019
- holdout should be 2020
| Model | Frequency | Recency | Monetary_Value | Output |
|---|---|---|---|---|
| DISCRETE | ||||
| BG/NBD | X | Pred_Txn | ||
| BG/NBD | X | Prob_Alive | ||
| Gamma-Gamma | X | Exp_Avg_Sales | ||
| NON-DISCRETE | ||||
| Pareto/NBD | ||||
| POP+POISSON | ||||
| MBG/NBD | ||||
| TBD | ||||
| BG/BB |
use Cross Validation Grid Search train on training data then evaluate on test data
t =
t =
t =
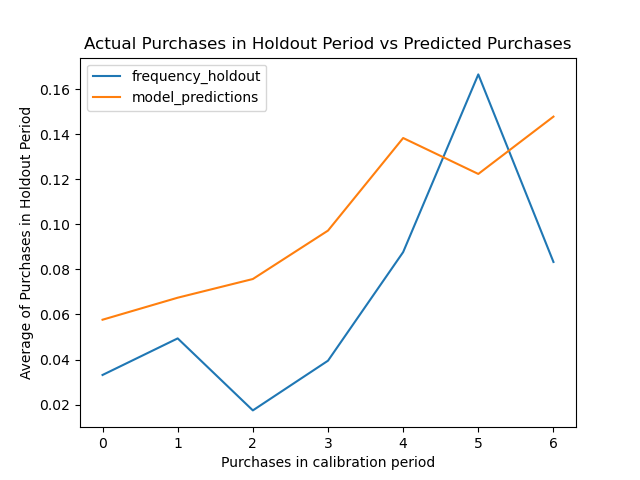
holdout =
holdout =
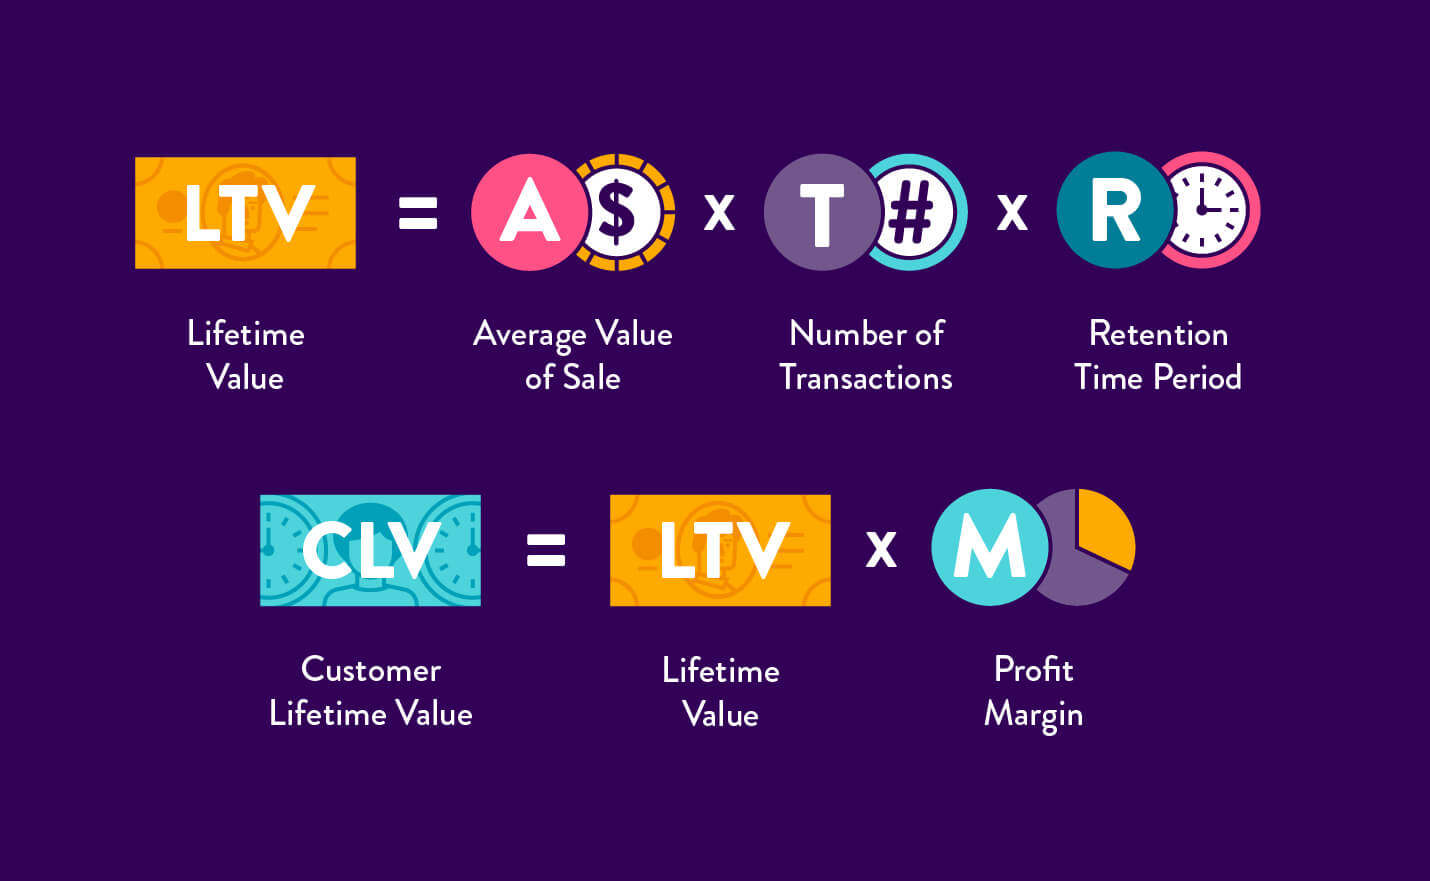
Cohorts | Exp. Avg Value of Sales | * | Exp. Txn| * |Retention | = | LTV | * |Profit Margin | = |CLTV | \ | WACC |= |(PV) CLTV
Einstein's quote on 55 minutes of an hour to solve a problem
McCarthy papers
Fader papers
Hardie notes & papers
lifetimes package: https://lifetimes.readthedocs.io/en/latest/index.html
Analytics Vidhya CLTV guide: https://www.analyticsvidhya.com/blog/2020/10/a-definitive-guide-for-predicting-customer-lifetime-value-clv/
Modelling CLTV for Non-Contractual Business with Python: https://towardsdatascience.com/whats-a-customer-worth-8daf183f8a4f
Cohort Analysis: https://towardsdatascience.com/a-step-by-step-introduction-to-cohort-analysis-in-python-a2cbbd8460ea
https://www.kdnuggets.com/2018/05/general-approaches-machine-learning-process.html
https://www.tablesgenerator.com/markdown_tables
