gse stands for Go Scheduler Exporter and contains the source and setup required to run the demo that was done as part of the talk Queues, Fairness, and The Go Scheduler. The slides for the talk can be found here.
On a high level:
gseexports scheduler traces for a particular binary to Prometheus to help observe and visualize the Go runtime scheduler.- It takes a config file which looks as follows:
Please see the comments here for more details on these fields.
path: "cmd to execute binary"
prometheus:
  endpoint: metrics
  port: 8080
sched:
  interval: 10 # frequency in ms at which scheduler traces will be emitted.
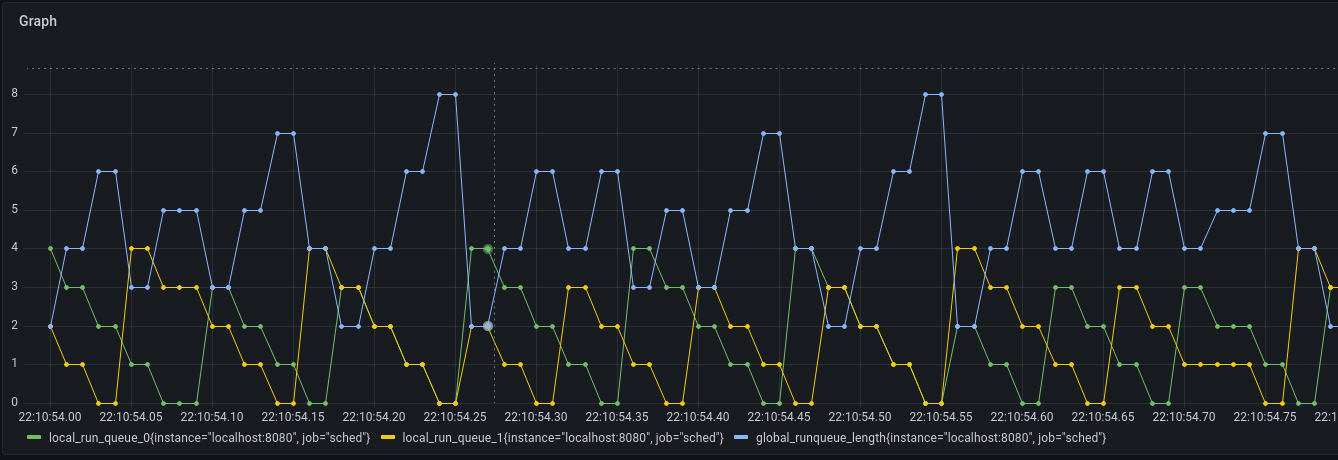
- The metrics exported are as follows:
- Run queue lengths of local runqueues
- Run queue length of global runqueue
- No. of idle procs
- No. of threads
- No. of spinning threads
- No. of idle threads
- These metrics can now be viewed in
grafana.
git clone https://github.com/MadhavJivrajani/gse.git && cd gse
go build .
# optional
mv ./gse /usr/local/binAn example program and config file can be found here.
go build -o gophercon main.goBefore actually running gse, make sure you have prometheus running whose config matches the prometheus part of the config provided to gse. The config I used and passed to a locally running prometheus was:
global:
  scrape_interval: 10ms

scrape_configs:
  - job_name: "sched"
    static_configs:
      - targets: ["localhost:8080"]
The 10ms scrape interval is provided since 10ms is also the timeslice given to a gorotuine, post which async preemption is attempted, and hence visualization becomes significantly clearer.
Actually run gse now:
gse -f example/test.yamlOnce running, you can open up grafana and add prometheus as a data source and visualize the exported metrics:
This part is orthogonal to gse, but here for reference!
To trace when a long running Gorutine is asynchronously preempted using the SIGURG signal, we can make use of the Linux tracing subsystem to get events whenever the SIGURG signal is issued.
To set things up, you need to be a root user first. Once you are, run the following:
./example/preemption_tracing/setup.shIn our example, the name of the binary was gophercon. If we search through the trace log for gophercon, we should be able to see the preemption events.
cat /sys/kernel/debug/tracing/trace | grep gophercon
