| Page Type | Languages | Key Services | Tools |
|---|---|---|---|
| Sample | Python | Azure DevOps Azure Functions Azure SQL Database |
Power BI |
Azure DevOps provides the ability to set and analyze capacity for teams and team members natively within sprint and at a summarized level across teams. However, there are times when you may want to perform more advanced analytics on capacity data, such as viewing capacity at a more granular level across teams within a Project, or across multiple Projects within your Organization. Using the Azure DevOps Capacities API, you can retrieve capacity data and perform advanced analytics on it.
This codebase provides a demonstration of how to retrieve capacity data from the Azure DevOps Capacities API and visualize it in Power BI. A conceptual approach to automating the process for an enterprise setup is also provided.
The scenario presented in this codebase is not intended for production use, and should be viewed as a foundation for modification and expansion into more complex applications.
- An Azure DevOps Organization and Project
- Within your Project, you will need to create a Team and a Sprint, and then begin to assign hours to team members by setting Capacity per day and entering estimated hours at the task level.
- Power BI
- Optional - Power BI License - for publishing reports to Power BI Service
- Python
- Optional - Azure Subscription - for building automated enterprise solution
This sample assumes you are running the code and viewing the report locally.
-
Create a Personal Access Token in Azure DevOps with the
Work Items (read and write)scopes. -
Set an environment variable named
AZDO_PATwith the value of your Personal Access Token. -
cdinto theappdirectory. -
In the
mainfunction ofapp.py, modify thegenerate_snapshotfunction call(s) to pass in your Organization, Project, Team, and Sprint. -
Run
pip install -r requirements.txtto install the required Python packages. -
Run
python app.pyto generate a CSV file containing capacity data for the specified Organization, Project, Team, and Sprint. -
Import the CSV file into Power BI and visualize the data.
- You may build a dashboard that meets your specific needs, but some ideas to include in your dashboard include:
- A gauge chart that displays the currently assigned hours against the remaining hours in the sprint.
- A row-selectable table which shows Sprints, Teams, and Organizations in the data model, so you can choose to filter the dashboard down to any level of granularity and view how fully utilized Sprints, Teams, and Organizations are.
- A row-selectable table showing the currently assigned hours for each team member in the data model, so you can choose to filter the dashboard down to the user level across Teams/Organizations.
- You may build a dashboard that meets your specific needs, but some ideas to include in your dashboard include:
- In the
generate_snapshotfunction, there is a block of code that identifies tasks as being work items with a parent from which to pull assigned hours. You can modify this block of code to fit your specific needs/work item type/DevOps process you are using. - The
mainfunction shows an example of how to call thegenerate_snapshotfunction for multiple parameter sets. Assuming that the code to pull the data is automated, you may opt to further parameterize the script to allow for more flexibility how the parameters are passed in (e.g., from a querystring). - Additional code to connect to a database and store the data is not included in this codebase - outputs are simply written to a CSV. Code to connect to a database can be added as part of an enterprise solution.
Note that this codebase will likely require modification to fit your specific needs, and requires sufficient testing to ensure expected behavior. Areas in the codebase that may require modification are called out with TODO comments.
- This codebase reads the PAT from an environment variable named
AZDO_PAT. Depending on your runtime environment, there could be more ideal ways to store the PAT, such as using Azure Key Vault. - Your PAT will work within an Organization. If you have multiple organizations, you will need to generate a PAT for each one, and you may need to further modify the script to support multiple PATs (currently it only supports one).
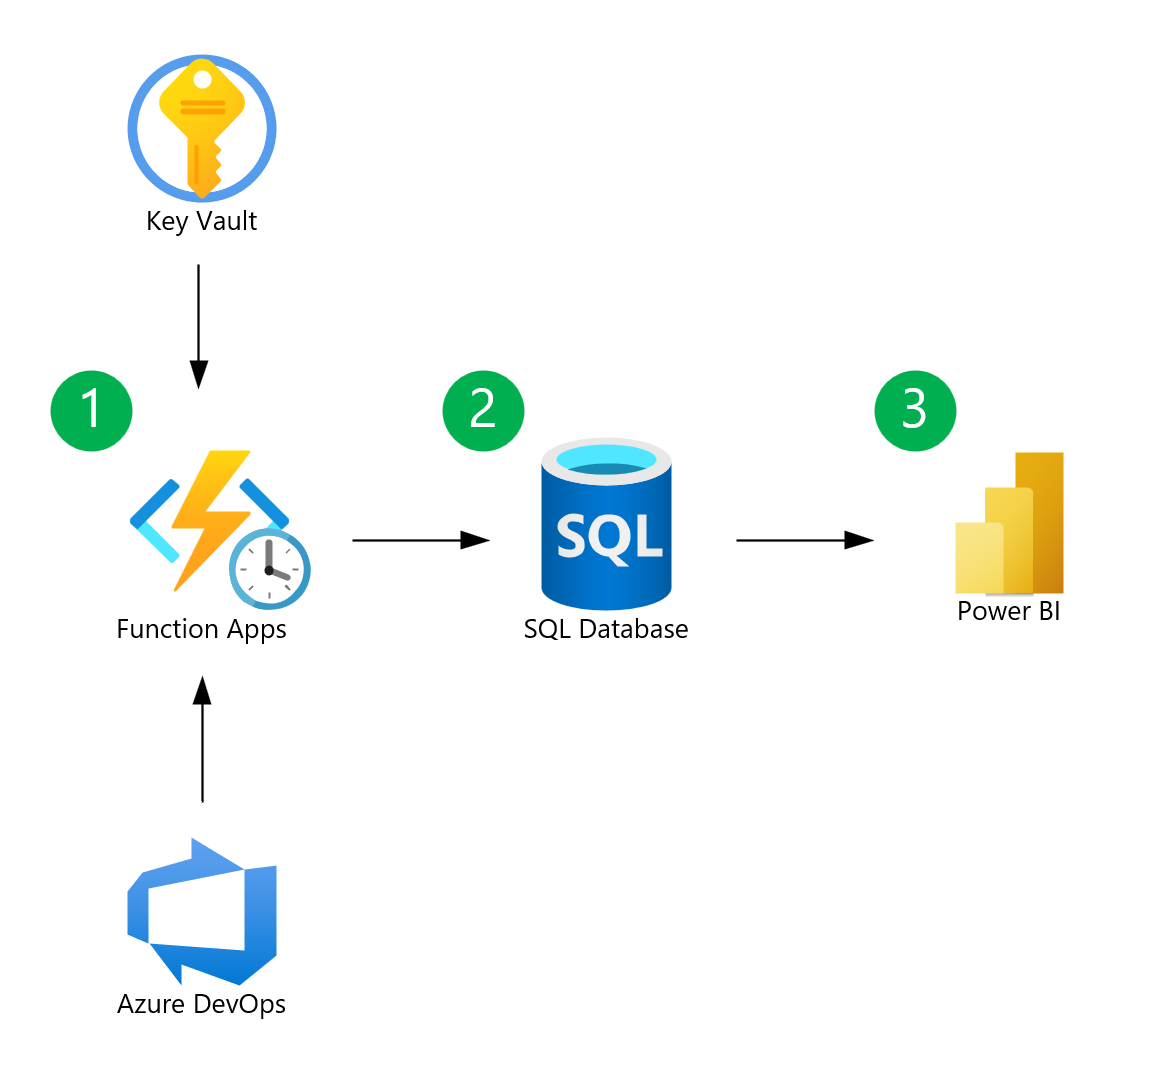
The below describes an approach suitable for an enterprise setup that leverages Azure Functions and Azure SQL Database to fully automate the process of retrieving and storing capacity data from the Azure DevOps Capacities API. While this infrastructure is not implemented in this codebase, it serves as a conceptual approach that can be modified to fit your specific needs.
Note that the data in this solution is point-in-time data, and should be routinely pulled and refreshed to ensure accuracy.
- An Azure Function is triggered (e.g., on a daily schedule or manually) to retrieve capacity data from the Azure DevOps Capacities API using the PAT stored in Azure Key Vault.
- The Azure Function stores the capacity data in an Azure SQL Database.
- A published Power BI report is connected to the Azure SQL Database and visualizes the refreshed capacity data.
- There are multiple use cases for performing cross-project capacity analytics. For example:
- In projects that involve multiple organizations (like joint ventures, partnerships, or consortia), cross-organizational capacity planning is crucial for coordinating efforts, timelines, and responsibilities.
- It supports strategic decision-making by providing insights into the capabilities and limitations of different organizations, allowing for better long-term planning.
- It helps in identifying bottlenecks and inefficiencies across organizations, leading to improved overall operational efficiency.
- Cross-team capacity analytics could be further complimented by Azure DevOps Delivery Plans and Azure DevOps Analytics Views in project planning.
