This document will show step-by-step to deploy a Elastic Stack Solution, AKA ELK (ElasticSearch, Logstash and Kibana), in Docker. Pre-required to this Environment :
- VM Linux or Linux OS
- 4GB RAM
- X GB Disk (will use a lot if you are using for Production Environments)
- Docker Installed
- Docker-compose Installed
For More information about ELK Solutions please visit Elastic Site elastic.co/
Inside the docker-compose.yml file you will find all instructions of docker needs to do the installation and configuration of ELK stack.
#First part we do the install / configuration of the ElastSearch Cluster
version: '2.2'

services:
  es01:
    image: docker.elastic.co/elasticsearch/elasticsearch:7.6.1
    container_name: es01
    environment: #In this case you passing the configuration parameters by envirounment Variable to the container
      - node.name=es01
      - cluster.name=es-docker-cluster
      - xpack.security.enabled=true #Xpack is optional check for more info -> https://www.elastic.co/guide/en/elasticsearch/reference/current/setup-xpack.html
      - discovery.seed_hosts=172.28.1.4,172.28.1.7
      - cluster.initial_master_nodes=172.28.1.3,172.28.1.4,172.28.1.7
      - "ELASTIC_USER=elastic" #Default User
      - "ELASTIC_PASSWORD=changeme" #Default Password
      - "ES_JAVA_OPTS=-Xms512m -Xmx512m" #increase memory for JAVA
    ulimits:
      memlock:
        soft: -1
        hard: -1
    volumes:
        #- ./config/elasticsearch.yml:/usr/share/elasticsearch/config/certs/elasticsearch.yml --> you can also send the configurations by mount
        - /home/elk/es01_data:/usr/share/elasticsearch/data:rw #Volume Mounted to keep Elastic DATA.

    ports:
      - 9200:9200 #Default Port
    networks:
        elastic:
          ipv4_address: 172.28.1.3 #DOCKER IP manual set (you can change or left automatic)

#Components Bellow is a copy with diferent IPs to Build the Cluster

  es02:
    image: docker.elastic.co/elasticsearch/elasticsearch:7.6.1
    container_name: es02
    environment:
      - node.name=es02
      - cluster.name=es-docker-cluster
      - xpack.security.enabled=true
      - discovery.seed_hosts=172.28.1.3,172.28.1.7
      - cluster.initial_master_nodes=172.28.1.3,172.28.1.4,172.28.1.7
      - "ELASTIC_USER=elastic"
      - "ELASTIC_PASSWORD=changeme"
      - "ES_JAVA_OPTS=-Xms512m -Xmx512m"
    ulimits:
      memlock:
        soft: -1
        hard: -1
    volumes:
      - ./config/elasticsearch.yml:/usr/share/elasticsearch/config/certs/elasticsearch.yml
      - /home/elk/es02_data:/usr/share/elasticsearch/data:rw
    networks:
        elastic:
          ipv4_address: 172.28.1.4

  es03:
    image: docker.elastic.co/elasticsearch/elasticsearch:7.6.1
    container_name: es03
    environment:
      - node.name=es03
      - cluster.name=es-docker-cluster
      - xpack.security.enabled=true
      - discovery.seed_hosts=172.28.1.3,172.28.1.4
      - cluster.initial_master_nodes=172.28.1.3,172.28.1.4,172.28.1.7
      - "ELASTIC_USER=elastic"
      - "ELASTIC_PASSWORD=changeme"
      - "ES_JAVA_OPTS=-Xms512m -Xmx512m"
    ulimits:
      memlock:
        soft: -1
        hard: -1
    volumes:
      - ./config/elasticsearch.yml:/usr/share/elasticsearch/config/certs/elasticsearch.yml
      - /home/elk/es03_data:/usr/share/elasticsearch/data:rw
    networks:
        elastic:
          ipv4_address: 172.28.1.7
The Second part of our docker-compose.yml file is about Kibana, it will be our Dashboard and will help us to "read" better the logs monitored.
  kib01:
    image: docker.elastic.co/kibana/kibana:7.6.1
    container_name: kib01
    ports:
      - 5601:5601 #Default Port To access Kibana
    environment:
      ELASTICSEARCH_URL: http://172.28.1.3:9200 #IP + Port of your Elastic Master node
      ELASTICSEARCH_HOSTS: http://172.28.1.3:9200 #IP + Port of your Elastic Master node
    volumes:
        - ./config/kibana.yml:/usr/share/kibana/config/kibana.yml #Mount for access the configuration file
    networks:
        elastic:
          ipv4_address: 172.28.1.5 #IP for your Kibana
    depends_on:
      - es01 #Kibana container Just will be up/running after container ES01 is up and running
    restart: unless-stopped
The last part of our docker-compose.yml file is the Logstash, it's ingests, transforms, and ships your data regardless of format or complexity. Derive structure from unstructured data with grok, decipher geo coordinates from IP addresses, anonymize or exclude sensitive fields, and ease overall processing.
  logs01:
    image: docker.elastic.co/logstash/logstash:7.6.1
    container_name: logs01
    ports:
        - 5044:5044 #Default Port To access Beats
        - 42262:42262
    environment:
      ELASTICSEARCH_URL: http://172.28.1.3:9200 #IP + Port of your Elastic Master node
      ELASTICSEARCH_HOSTS: http://172.28.1.3:9200 #IP + Port of your Elastic Master node

    ulimits:
        memlock:
            soft: -1
            hard: -1
    volumes:
        - ./config/logstash/logstash.conf:/usr/share/logstash/pipeline/logstash.conf #Mount for access the configuration file
        - ./config/logstash/logstash.yml:/usr/share/logstash/config/logstash.yml #Mount for access the configuration file
    networks:
        elastic:
          ipv4_address: 172.28.1.6 #IP for your Logstash
    depends_on:
      - es01 #As Kibana Logstash just start one the ElasticSearch is us and running
    restart: unless-stopped
Our Logstash configuration file (logstash.conf) is expected receive the log file from some Beat (Beats Reference)
To Get get this compose up run in your Linux terminal (Where you did the Clone of this git)
docker-compose up -dAfter some minutes the stack should be up. Check running
docker ps -aGo to your web browser and type:
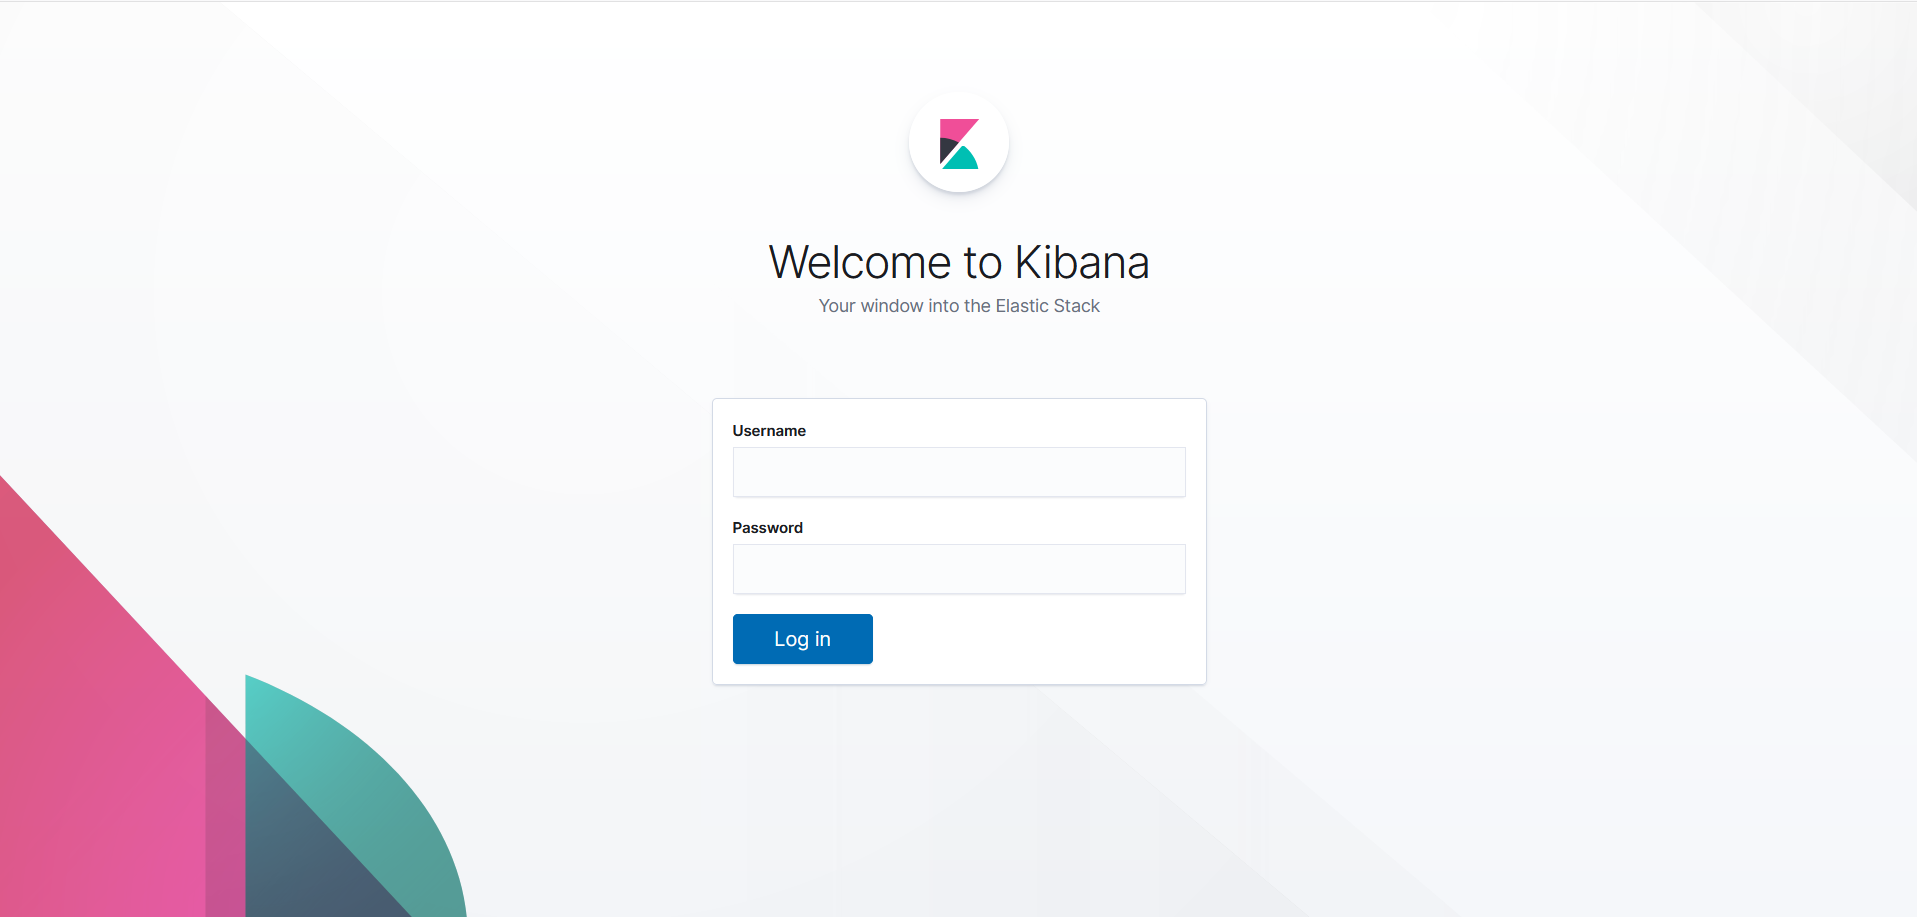
http://localhost:5601/login?next=%2FYou should see this screen:
Enter your User (elastic) and Password (changeme) to access the Kibana
Done Your ELK Stack is up and Running. For more information about ELK please visit elastic.co/
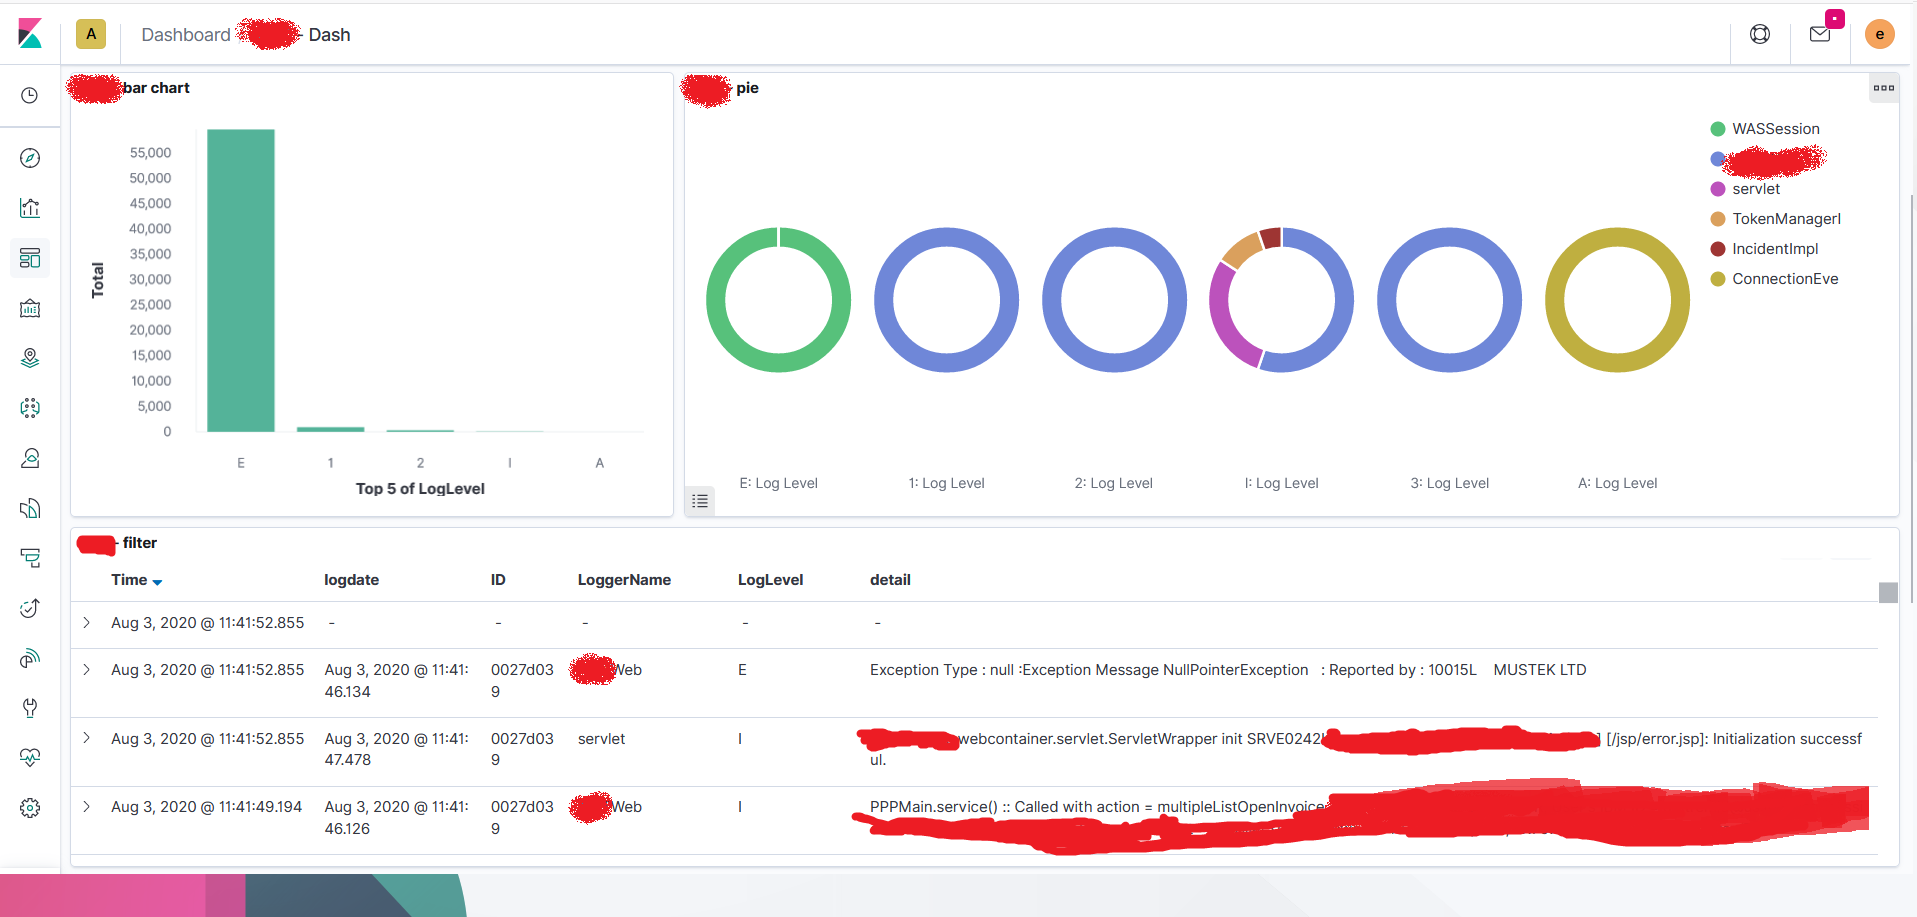
My POC was very good and has run as expected, I was able to get logs (using MetricBeat and FileBeat (Beats Reference) from my local Docker and from On-prem Openshift as well.
With Kibana I had made some Dashboards as well, nothing fence 🙃, but had worked

