R tools for monitoring effectiveness of COVID-19 control efforts
COVID-19 + RECON suite of tools for outbreak epidemiology + R = covidrecon
The development version from GitHub with:
# install.packages("devtools")
devtools::install_github("CBDRH/covidrecon")library(covidrecon)
## basic example codeprovinces_confirmed_jh <- covid_pull_data()
provinces_confirmed_jh
#> # A tibble: 27,144 x 8
#> province country_region lat long date cumulative_cases
#> <chr> <chr> <dbl> <dbl> <date> <dbl>
#> 1 <NA> Afghanistan 33 65 2020-01-22 0
#> 2 <NA> Afghanistan 33 65 2020-01-23 0
#> 3 <NA> Afghanistan 33 65 2020-01-24 0
#> 4 <NA> Afghanistan 33 65 2020-01-25 0
#> 5 <NA> Afghanistan 33 65 2020-01-26 0
#> 6 <NA> Afghanistan 33 65 2020-01-27 0
#> 7 <NA> Afghanistan 33 65 2020-01-28 0
#> 8 <NA> Afghanistan 33 65 2020-01-29 0
#> 9 <NA> Afghanistan 33 65 2020-01-30 0
#> 10 <NA> Afghanistan 33 65 2020-01-31 0
#> # … with 27,134 more rows, and 2 more variables: incident_cases <dbl>,
#> # continent <chr>library(dplyr)
#>
#> Attaching package: 'dplyr'
#> The following objects are masked from 'package:stats':
#>
#> filter, lag
#> The following objects are masked from 'package:base':
#>
#> intersect, setdiff, setequal, union
high_incidence_countries <- covid_high_incidence(provinces_confirmed_jh) %>%
mutate(alpha = ifelse(country_region == "Australia", 1, 0.7)) %>%
filter(normalised_date >= 0)
high_incidence_countries
#> # A tibble: 573 x 9
#> country_region date incident_cases cumulative_cases hit_100 rnum
#> <chr> <date> <dbl> <dbl> <lgl> <int>
#> 1 Armenia 2020-03-19 31 115 TRUE 58
#> 2 Australia 2020-03-10 16 107 TRUE 49
#> 3 Australia 2020-03-11 21 128 FALSE 50
#> 4 Australia 2020-03-12 0 128 FALSE 51
#> 5 Australia 2020-03-13 72 200 FALSE 52
#> 6 Australia 2020-03-14 50 250 FALSE 53
#> 7 Australia 2020-03-15 47 297 FALSE 54
#> 8 Australia 2020-03-16 80 377 FALSE 55
#> 9 Australia 2020-03-17 75 452 FALSE 56
#> 10 Australia 2020-03-18 116 568 FALSE 57
#> # … with 563 more rows, and 3 more variables: normalised_date <int>,
#> # continent <chr>, alpha <dbl>library(ggplot2)
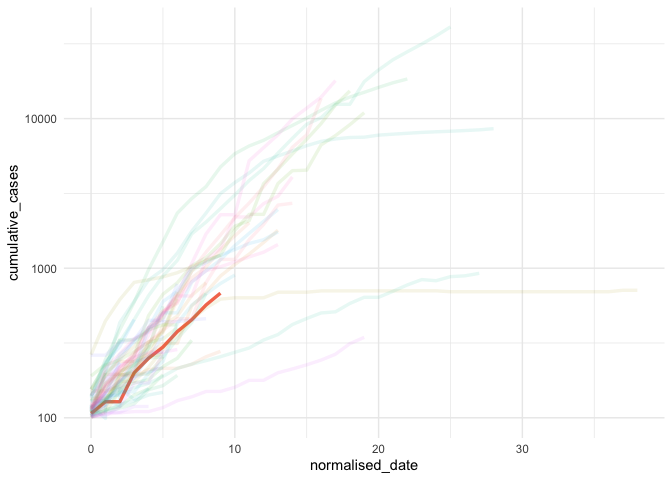
ggplot(data = high_incidence_countries,
aes(x = normalised_date,
y = cumulative_cases,
colour = country_region)) +
geom_line(aes(alpha = alpha),
size = 1.2) +
scale_y_log10() +
theme_minimal() +
theme(legend.position = "none")library(gghighlight)
selected_countries <- c("China",
"Singapore",
"Japan",
"Iran",
"Italy",
"Spain",
"US",
"United Kingdom",
"Australia",
"France",
"Korea, South")
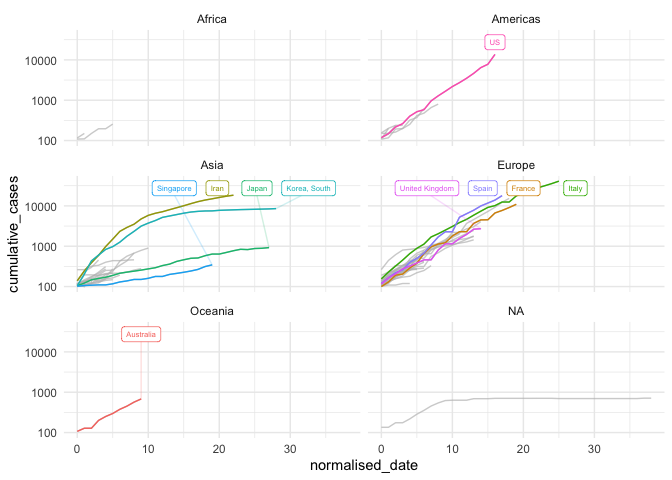
ggplot(data = high_incidence_countries,
aes(x = normalised_date,
y = cumulative_cases,
colour = country_region)) +
# geom_line(aes(alpha = alpha),
# size = 1.2) +
geom_line() +
facet_wrap(~ continent, ncol = 2) +
scale_y_log10() +
theme_minimal() +
theme(legend.position = "none") +
gghighlight(
country_region %in% c(
selected_countries
),
label_params = list(size = 2,
nudge_y = 10,
segment.alpha = 0.2),
calculate_per_facet = TRUE,
use_group_by = FALSE
)
#> label_key: country_region
