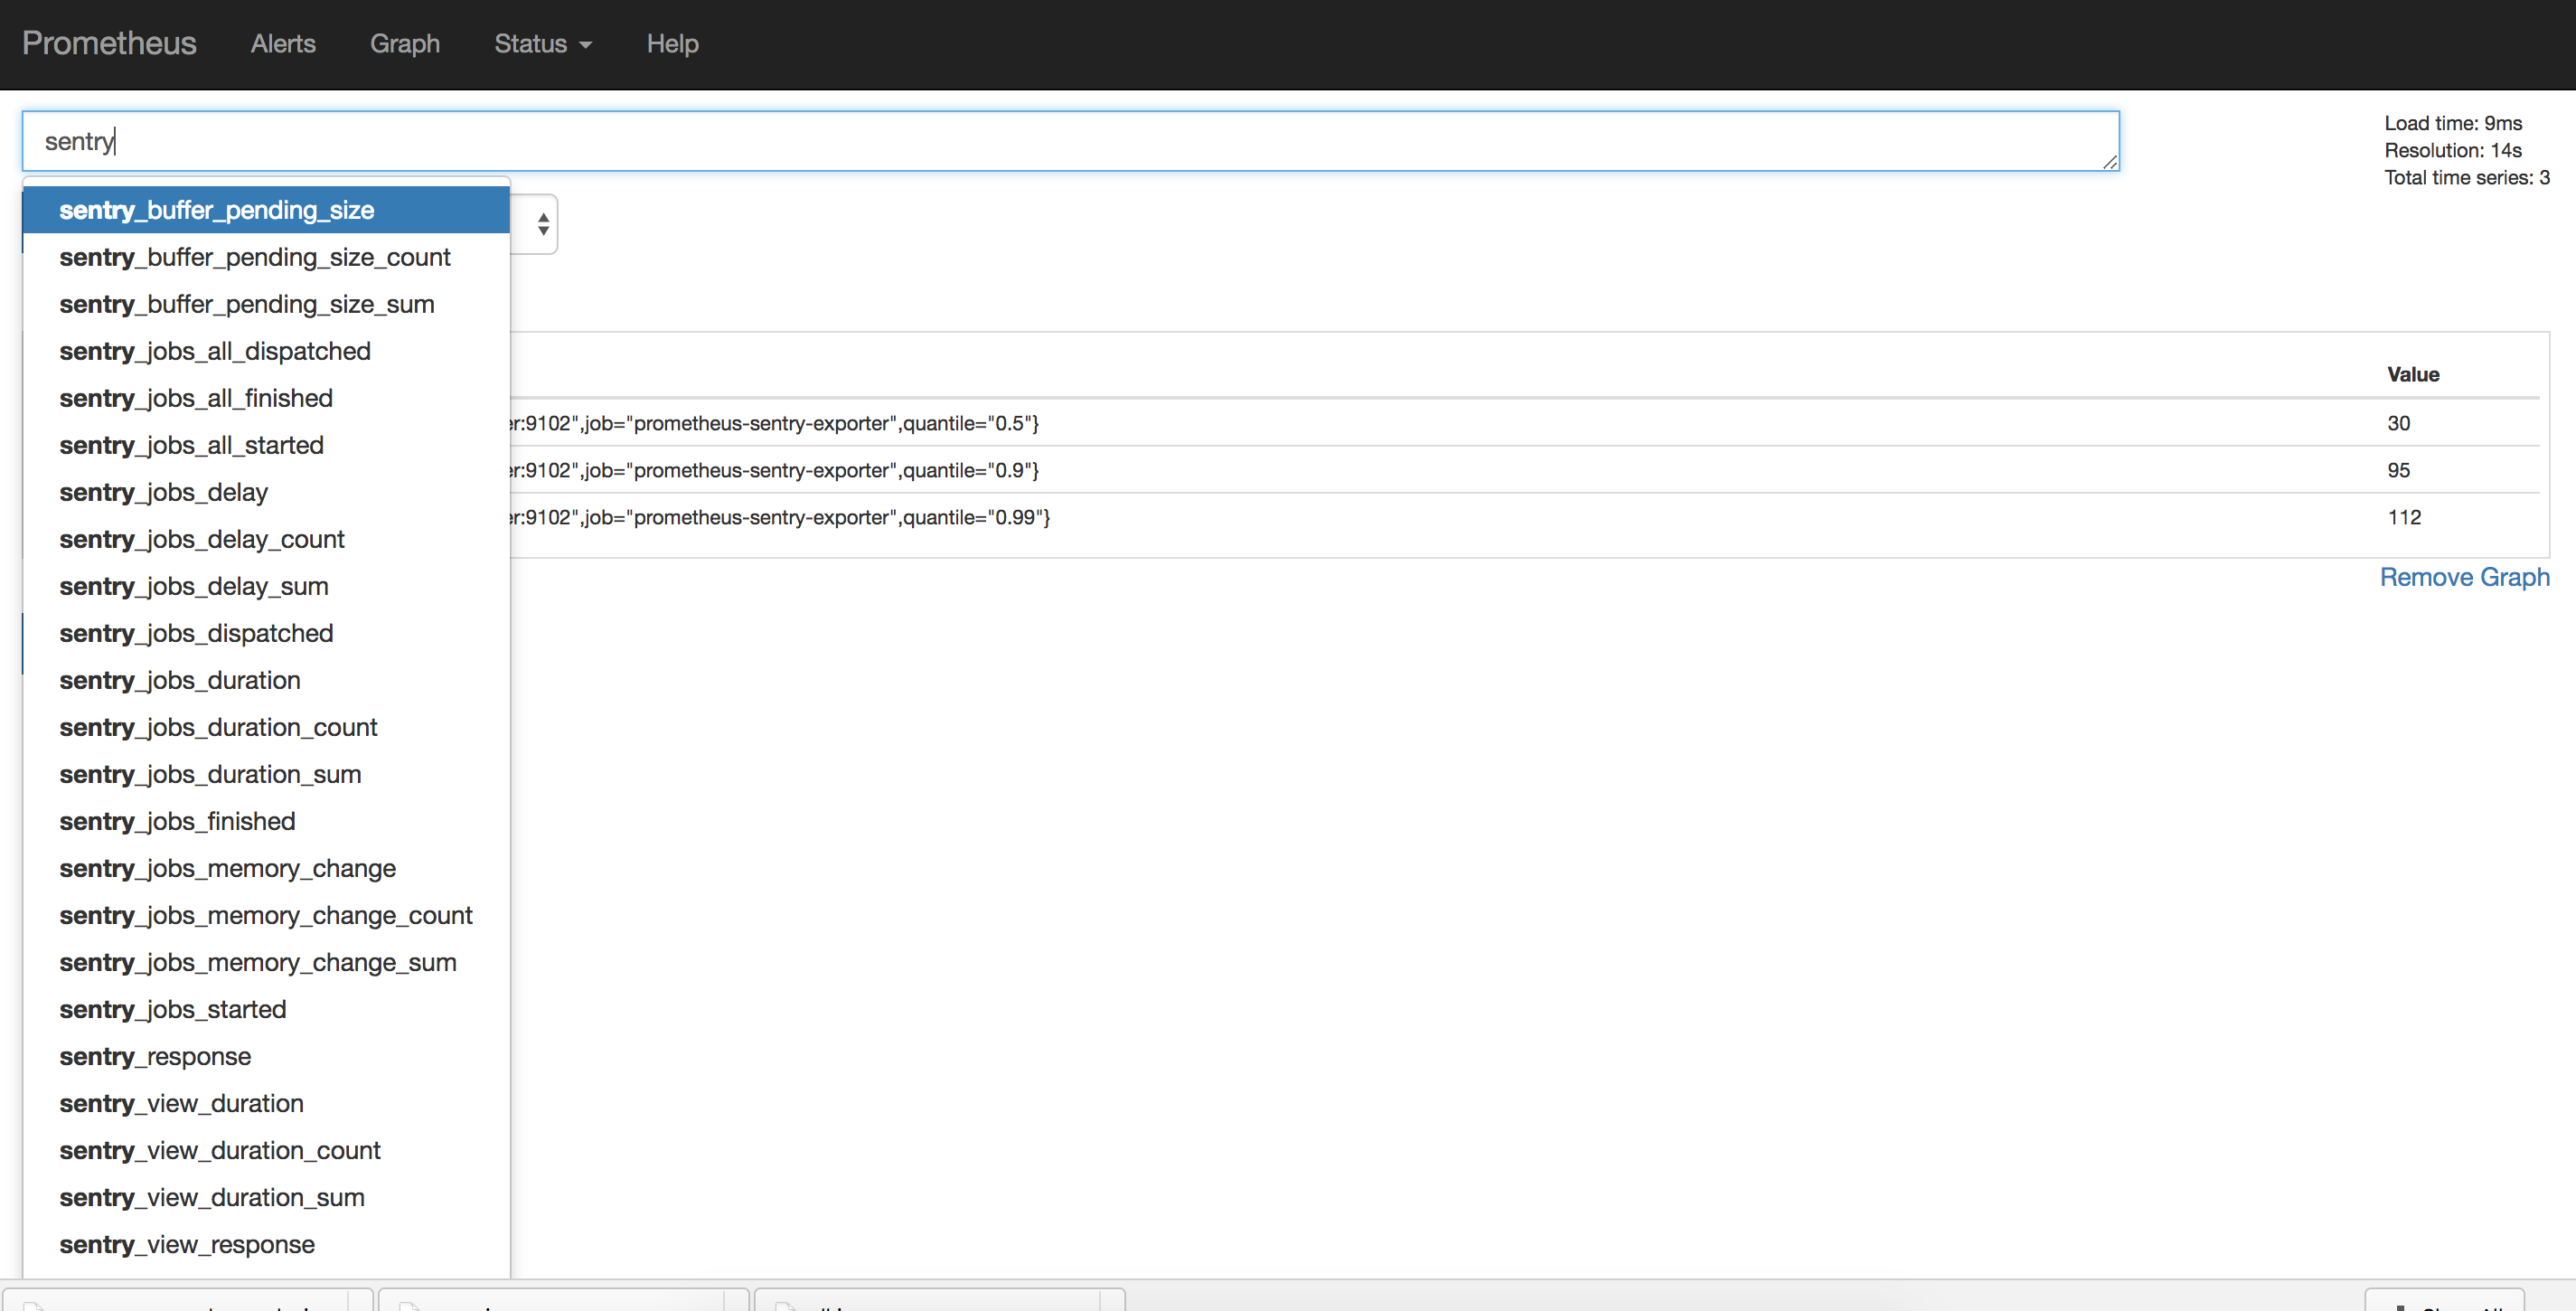
Since sentry does not support prometheus as a monitoring backend, we can send StatsdMetricsBackend metrics to
statsd_exporter and configure prometheus to scrape them.
- Add grafana dashboard
- Deploy to kubernetes/minikube
docker-compose build
docker-compose up-
to view the scraped metrics in prometheus navigate to
http://localhost:9090/ -
to view the translated statsd metrics navigate to
http://localhost:9102/metrics
-
The first time you do
docker-compose up, you need to run:-
docker exec -it <sentry_web_container_id> bash -
sentry upgrade(we need to create database tables, and create a superuser account). -
docker-compose stop -
docker-compose up
-
-
The statsd metrics backend is configured in
sentry.conf.py. Ref: (https://github.com/getsentry/sentry/blob/master/docs/internal-metrics.rst)
# Sentry statsd exporter config
SENTRY_METRICS_BACKEND = 'sentry.metrics.statsd.StatsdMetricsBackend'
SENTRY_METRICS_OPTIONS = {
    'host': os.environ.get('SENTRY_METRICS_HOST'),
    'port': os.environ.get('SENTRY_METRICS_PORT')
}