Plot the graph of the function f(t) = sin(t) in the interval [-π, π], with red dots. Label the x-axis and y-axis with "time" and "value", respectively.
Define the following matrices using the numpy library:
A: A matrix of all zeros.
B: A matrix of all ones.
C: A diagonal matrix of size 5x5.
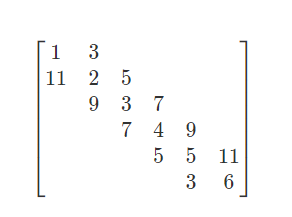
D: A matrix in the form:
Create a random matrix and compute its determinant.
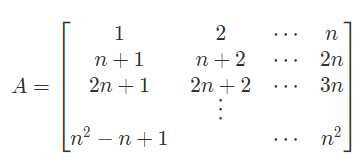
Define a matrix as follows:
Print the following submatrices:
- The first row of the matrix
- The first column of the matrix
- The first three rows and columns of the matrix
- The last row of the matrix
- The last column of the matrix
- The last three columns of the matrix
- The last three columns of the first three rows of the matrix
- The diagonal of the matrix
- The odd-numbered rows (1st, 3rd, 5th, etc.) of the matrix
- A matrix B such that its first row is the last row of A, its second row is the second-to-last row of A, and its last row is the first row of A.
- A matrix D that consists of the odd-indexed rows and even-indexed columns of A.
Plot the function f(x,y) = x^2 + y^2 over the interval [-3, 3].
Plot the functions f(x) = sin(x) and g(x) = cos(x) in the following ways:
- In a single plot
- In two separate plots
- In a single plot with two subplots

