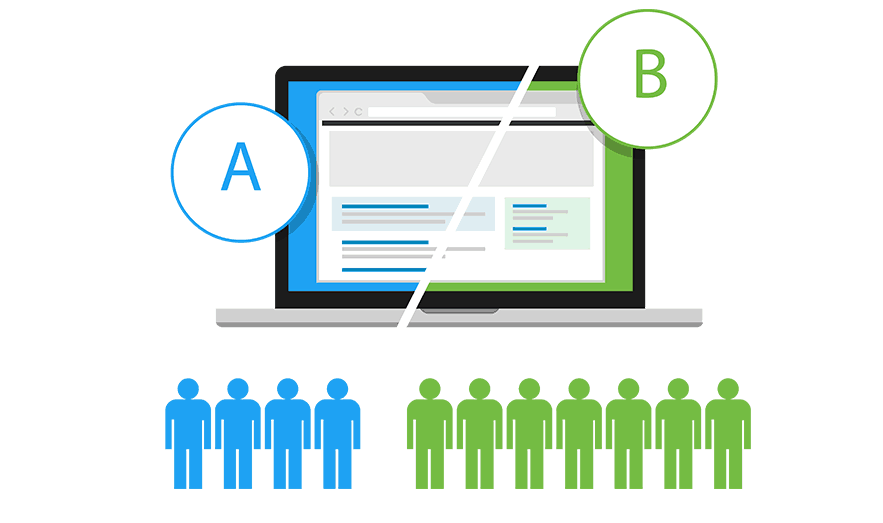
AB testing, also known as split testing, is a statistical method used to compare two or more variations of a web page or app feature to determine which one performs better in terms of user engagement or conversion rate. This project aims to compare the performance of two bidding methods, Maximum Bidding (Control) and Average Bidding (Test), in terms of user engagement and revenue generation.
The dataset contains information about a company's website and includes the following columns:
- Impression: The number of times the ads were displayed or viewed by users.
- Click: The number of times users clicked on the displayed ads after viewing them.
- Purchase: The number of times users made purchases after clicking on the ads.
- Earning: The revenue generated from the purchases made.
The dataset is divided into two groups:
- Control Group: Where Maximum Bidding was applied.
- Test Group: Where Average Bidding was implemented.
The hypothesis for the AB testing comparing the Maximum Bidding (Control) and Average Bidding (Test) techniques on the Purchase column can be stated as follows:
- Null Hypothesis (H0): There is no significant difference in the average number of purchases between the Control (Maximum Bidding) and Test (Average Bidding) groups.
- Alternative Hypothesis (H1): There is a significant difference in the average number of purchases between the Control (Maximum Bidding) and Test (Average Bidding) groups.
The following steps were performed for the AB testing:
-
Data Exploration: The dataset was analyzed to gain insights into its structure and distributions.
-
Assumptions Check: To ensure the validity of the test results, the following assumptions were verified:
- Normality Check: The data in each group should be approximately normally distributed. The Shapiro-Wilk test was used for normality check.
- Homogeneity of Variance: The variances of the data in the two groups should be approximately equal. The Levene's test was used for this purpose.
-
T-Test: An independent two-sample t-test was performed to compare the purchase rates between the two bidding techniques.
The results of the AB testing showed that there was no significant difference in the average number of purchases between the Maximum Bidding (Control) and Average Bidding (Test) groups. Hence, we couldn't reject the null hypothesis.
To optimize overall campaign success, it is recommended to:
- Diversify bidding strategies and explore other key performance indicators.
- Continuously perform A/B testing to adapt to changing market dynamics and platform algorithms.
Note: The project code and analysis can be found in the provided Python script in this repository.
