Matlab implementation of "A Cross-Scape Plot Representation for Visualizing Symbolic Melodic Similarity, ISMIR 2019".
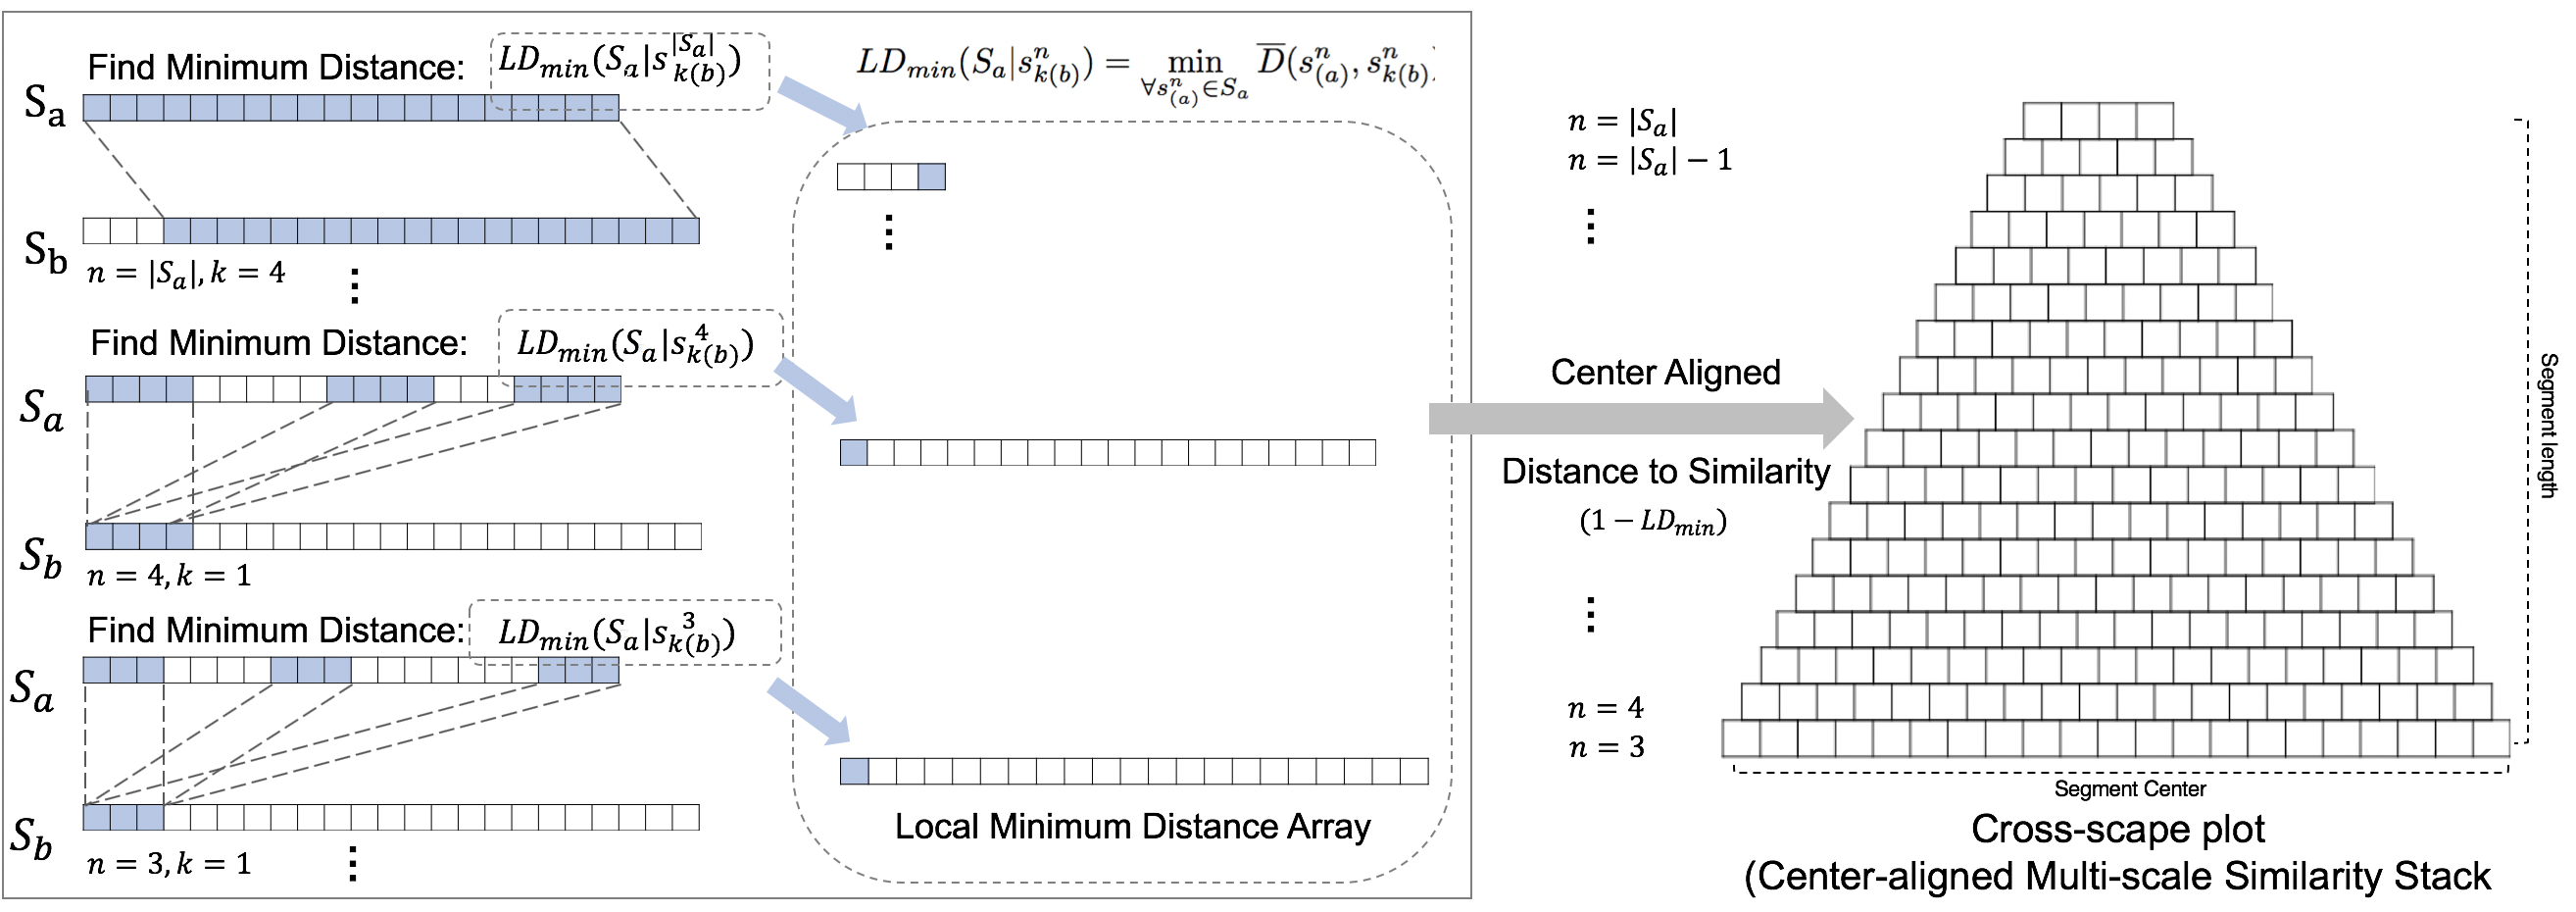
The cross-scape plot is computed by stacking up a minimum local distance between segments from each of the two songs. After segmenting the songs, the local similarity is performed by a sequence-based similarity algorithm for all possible segments of the two songs. As the layer goes up, the segment size increases and it computes progressively more long-term distances. It is described by a hierarchical visual representation with a triangular or trapezoidal shape.
- Load midi files to be compared. (by MIDI toolbox 1.1)
song_a = readmidi(midi_file_path1)
song_b = readmidi(midi_file_path2)
- Caculate distance matrix between two songs.
dist_mat = get_distance_matrix(song_a, song_b, pitch_or_rhythm) % picth = 1, rhythm = 2
- Caculate similarity score from distance matrix.
score = get_similarity_score(dist_mat)
An example of a cross-scape plot. The local similarity is indicated by color (pitch: red, rhythm: green). The x-axis shows the location of the longer melody. The y-axis represents the segment size.
This sample case is one of the plagiarism cases (Mood Music v. De Wolfe) and the following links provide resources for this case.
- https://blogs.law.gwu.edu/mcir/case/mood-music-v-de-wolfe/
- https://www.lostinmusic.org/Cases/Detail/3-mood-music-vs-de-wolfe-music#tab_evidence
Note: The Python version of this implementation has been updated, and the link to the updated code can be found here: Cross-Scapeplot_Demo.ipynb.

