This package contains currently 6 plotting functions for chicken RNA seq data, as well as an annotated gene id /gene name table.
It also provides a chicken gene table gnames from ensembl.
The functions mFeatureplot, mDotPlot2, mVolcanoplot, and mPheatmapDESeq2 allow you to add your own gnames table, making it applicable to all species. The table should contain two columns named: "Gene.stable.ID" and "Gene.name".
To install modplots run in R:
devtools::install_github("safabio/modplots", ref="main")Allows you to plot any embedding of your Seurat object, and highlight gene expression from any assay. Currently there is no control over the assay used. Please set the active assay beforehand. Contrary to Seurats FeaturePlot, you have greater control over the color gradient, and it allows you to specify genes via name and not IDs. Also the title of the plot will be the gene's name, instead of its stable ID.
Modified DotPlot function from Seurat. Automatically adds gene names as labels. Input has to be gene IDs for now.
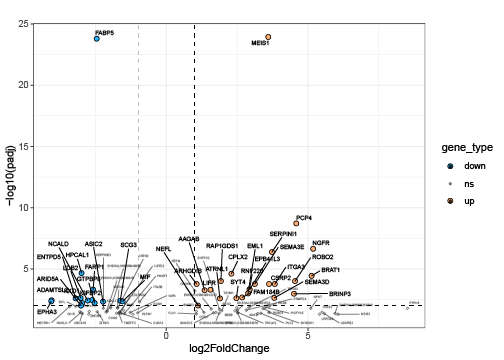
Volcano plot function for Seurat and DESeq2 generated DE tables. The backbone of the function is taken from here.
Also any other DE table can be given as input, the column names should contain: "gene" or "id" for the ID column, "2F" for the log2 fold change, and "adj" for the adjusted p values.
Plot can be generated with plotly to create an interactive plot to inspect directly gene names, p val adj and lo2FC's.
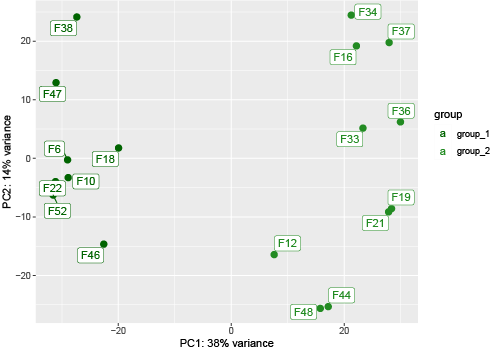
Function using plotPCA from DESeq2. You can specify grouping variables and PCs to plot. Additionally you can use shape and label aesthetics to control those ggplot parameters in geom_point().
Automatically returns pca object (prcomp output) to global env.
Currently there is no plotly implementation, group, shape, and label should be sufficient aesthetics. For a high number of samples, overplotting might become a problem.
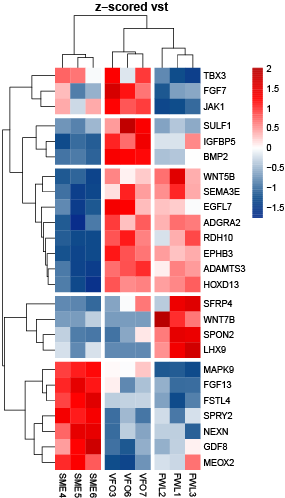
Modified pheatmap function for vst transformed dds objects.
Plots the absolute loadings of a prcomp object. At the same time it adds the names of the top n loading genes (by absolute value).
Gg6 gene ID and name table. For details use: ?gnames.
Function that takes the limma::goana output table and the ENTREZ IDs for the goana geneset and maps the genes to the GO terms that are enriched. Output is a table that contains GO term ID and annotation, Gene ID and names, as well as the goana output data (enrichment).


