This is our solution. It's based on the (unintentionally) open-sourced code by Florian Muellerklein: https://github.com/FlorianMuellerklein/kaggle_tgs_salt However, we tuned it and prepared several ensembles with our solutions using bagging and stacking.
Features:
- SE-ResNext;
- Hypercolumn;
- 5 folds;
- 3 standard losses (binary cross-entropy, Focal loss and Lovacz loss) combined with contour-detection loss;
- pseudo-labeling;
- use of mosaic.
Mosaic was a test dataset leakage which was specific to the way how organizers prepared the test dataset. It turned out that they had a few dozens of seismic images of high resolution. So they split them into 22,000 images, of which they made 4,000 train images and 16,000 test images (random train/test split). This turned out to be a data leak because salt typically occupies significantly more than one image. If you can find a train image next to the test image, you can make a reasonable guess of what might be in your test image because geological data is continuous.
Pictures are priceless.
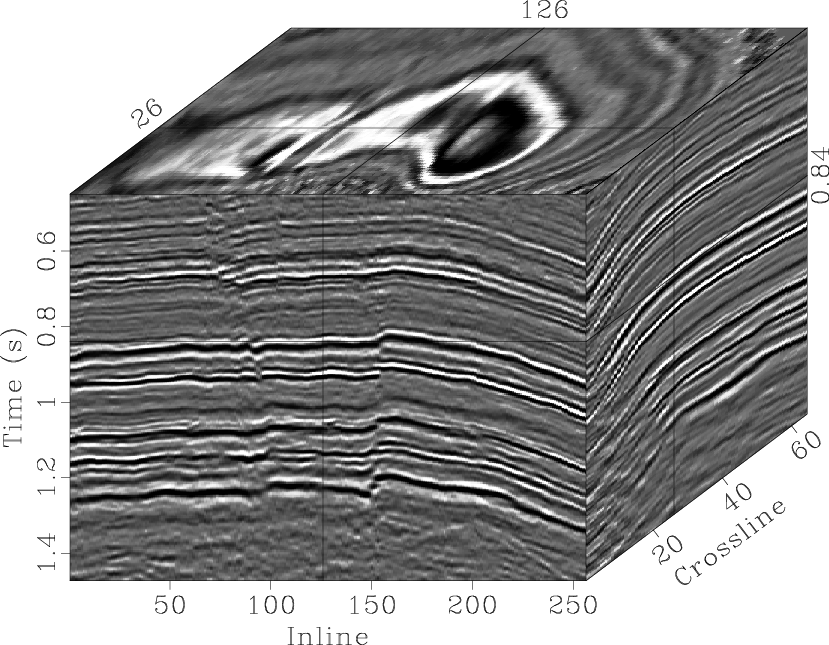
This is how seismic data looks in general.


