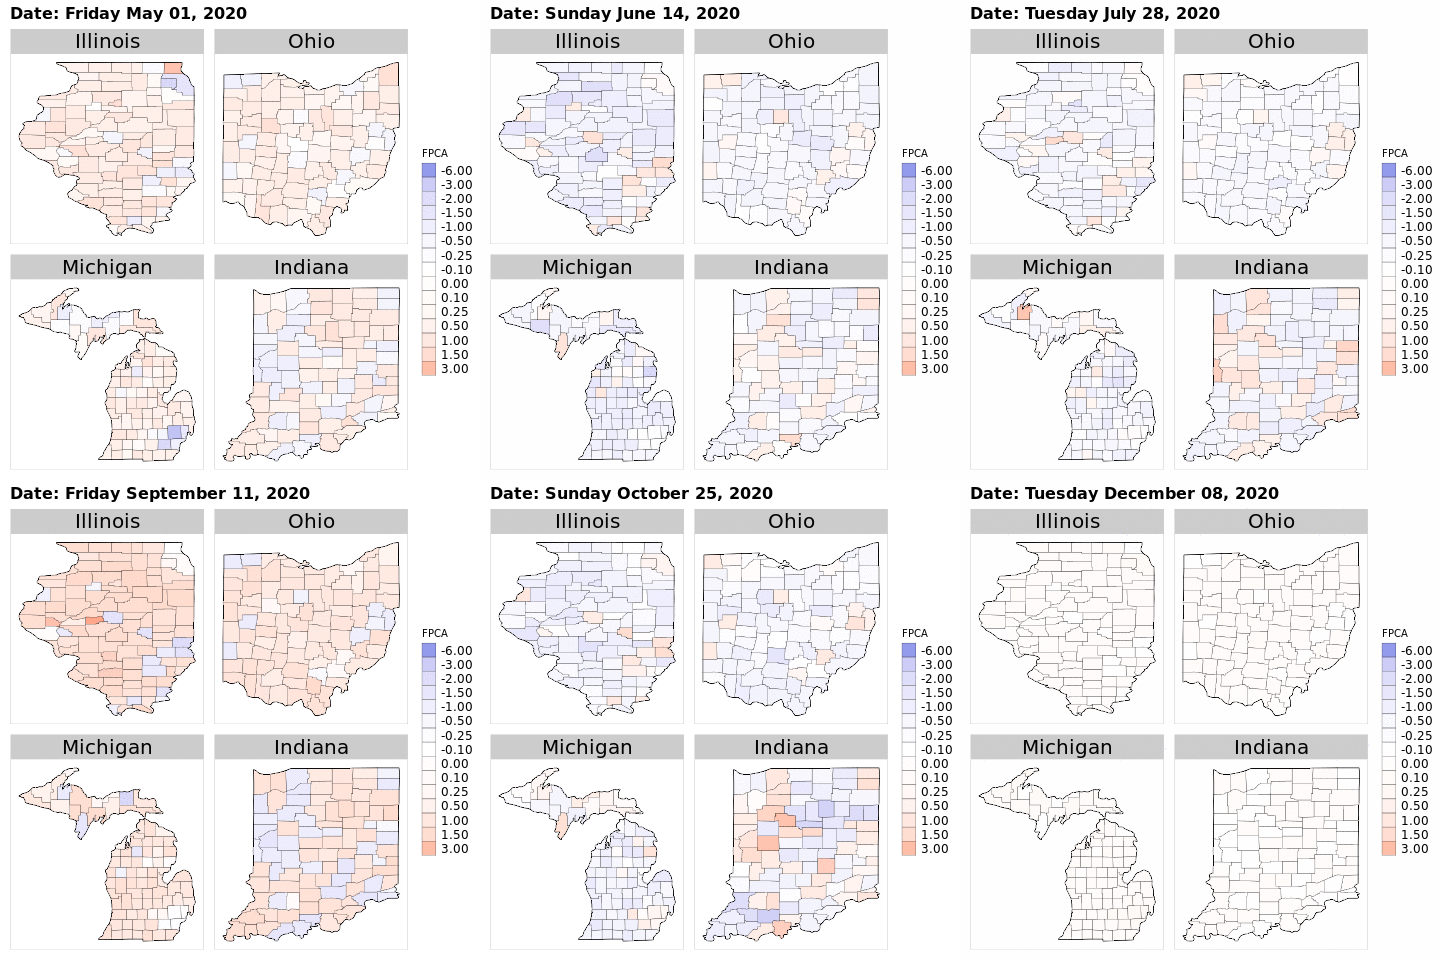
- 00-analysis-state.R has the master file to run the analysis and it uses MO_OH_Aug_2.Rmd and fpca_single_template.Rmd to generate the results.
- five_states_start_open_4_14_lags_CCVI_NYT_predifnedKnots_ns_k5_m2_ccvi_quintile.rds has the stored model results
- five_states_ccviquintile_density_popoffset_4_14_sentSep10_FINAL.html is the final results used in the paper
- The raw data from safegraph is in
data/2019anddata/2020. These are the Social Distancing Metrics v2.1 downloaded via the aws command line interface from the safegraph data catalog https://catalog.safegraph.io/app/browse - Note that the data is actually stored in
/data/bhatnagar-lab/COVID19. I've created a symbolic link to the/scratch/bhatnagar-lab/sbhatnagar/mcgill/research/COVID19/datafolder. - Census data comes from the American Community Survey. Census block group shapefiles, with linked data from the 5-year 2013-2017 ACS, are available here. (We note that, as described in the Methods, we use the 1-year 2018 estimates for the current population of each census block group.) The mapping from counties to MSAs is available here.
05-data_SD_safegraph.Rgenerates the aggregated data file. The CSV file generated isdata/aggregated_2020-12-08_2020.csv06-baselines.Rthat takes in the aggregated mobility summary data produced from the05-data_SD_safegraph.Rscript (data/aggregated_2020-12-08_2020.csv) and calculates the baseline values. A 7-day rolling average is calculated and used as a baseline. Then the days are shifted back by 1 so that the rolling average of the 7 previous days will be a baseline for the 8th. The resulting file is written asdata/metrics_2020_summary_and_baseline.csv07-change.Rwhich reads in thedata/metrics_2020_summary_and_baseline.csvfile produced from the06-baselines.Rscript, and calculates the change in baseline from the aggregated mobility data summary produced by05-data_SD_safegraph.R. The change from baseline of each mobility metric is calculated and the data is written asdata/2020_change_2020_baselines.csv. This is the file that'll be needed for data analysis. For the variable names:NAME_baselineare the baseline values,NAME_changeare the change from baseline values, andNAMEare the actual aggregated mobility metrics.
