Monitor your applications and troubleshoot problems in your deployed applications, an open-source alternative to DataDog, New Relic, etc.
SigNoz helps developer monitor applications and troubleshoot problems in their deployed applications. SigNoz uses distributed tracing to gain visibility into your software stack.
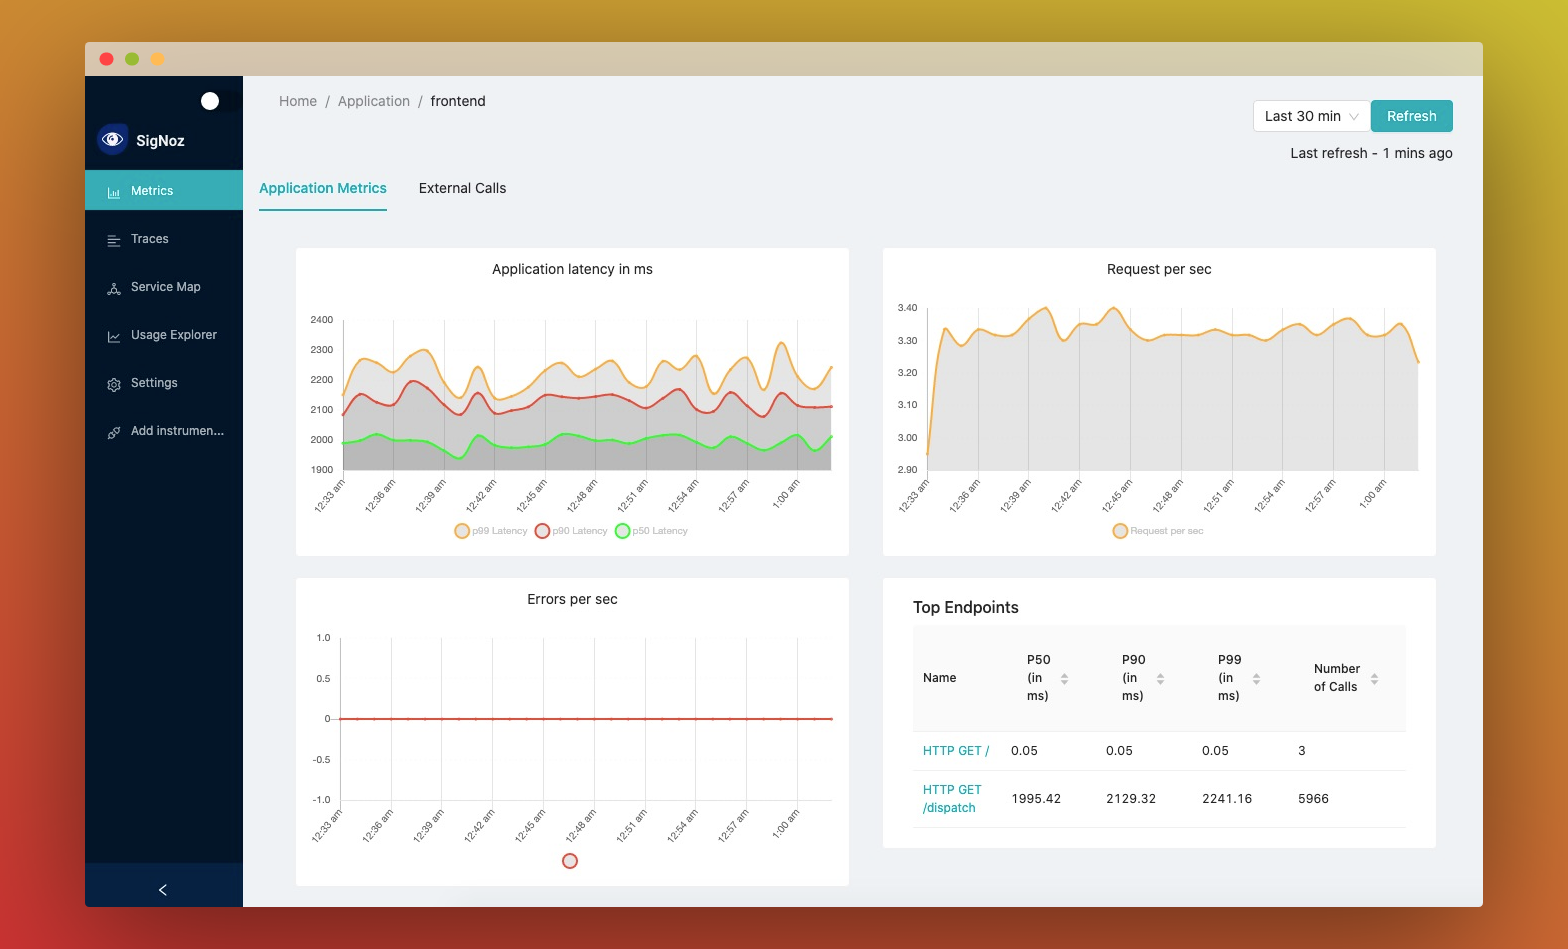
👉 You can see metrics like p99 latency, error rates for your services, external API calls and individual end points.
👉 You can find the root cause of the problem by going to the exact traces which are causing the problem and see detailed flamegraphs of individual request traces.
- Application overview metrics like RPS, 50th/90th/99th Percentile latencies, and Error Rate
- Slowest endpoints in your application
- See exact request trace to figure out issues in downstream services, slow DB queries, call to 3rd party services like payment gateways, etc
- Filter traces by service name, operation, latency, error, tags/annotations.
- Aggregate metrics on filtered traces. Eg, you can get error rate and 99th percentile latency of
customer_type: goldordeployment_version: v2orexternal_call: paypal - Unified UI for metrics and traces. No need to switch from Prometheus to Jaeger to debug issues.
Being developers, we found it annoying to rely on closed source SaaS vendors for every small feature we wanted. Closed source vendors often surprise you with huge month end bills without any transparency.
We wanted to make a self-hosted & open source version of tools like DataDog, NewRelic for companies that have privacy and security concerns about having customer data going to third party services.
Being open source also gives you complete control of your configuration, sampling, uptimes. You can also build modules over SigNoz to extend business specific capabilities
We support OpenTelemetry as the library which you can use to instrument your applications. So any framework and language supported by OpenTelemetry is also supported by SigNoz. Some of the main supported languages are:
- Java
- Python
- NodeJS
- Go
You can find the complete list of languages here - https://opentelemetry.io/docs/
We have a tiny-cluster setup and a standard setup to deploy using docker-compose. Follow the steps listed at https://signoz.io/docs/deployment/docker/. The troubleshooting instructions at https://signoz.io/docs/deployment/docker/#troubleshooting may be helpful
Below steps will install the SigNoz in platform namespace inside your k8s cluster.
git clone https://github.com/SigNoz/signoz.git && cd signoz
helm dependency update deploy/kubernetes/platform
kubectl create ns platform
helm -n platform install signoz deploy/kubernetes/platform
kubectl -n platform apply -Rf deploy/kubernetes/jobs
kubectl -n platform apply -f deploy/kubernetes/otel-collector*You can choose a different namespace too. In that case, you need to point your applications to correct address to send traces. In our sample application just change the JAEGER_ENDPOINT environment variable in sample-apps/hotrod/deployment.yaml
kubectl create ns sample-application
kubectl -n sample-application apply -Rf sample-apps/hotrod/kubectl -n sample-application run strzal --image=djbingham/curl --restart='OnFailure' -i --tty --rm --command -- curl -X POST -F 'locust_count=6' -F 'hatch_rate=2' http://locust-master:8089/swarm
kubectl -n platform port-forward svc/signoz-frontend 3000:3000
kubectl -n sample-application run strzal --image=djbingham/curl --restart='OnFailure' -i --tty --rm --command -- curl http://locust-master:8089/stop
You can find docs at https://signoz.io/docs/deployment/docker. If you need any clarification or find something missing, feel free to raise a GitHub issue with the label documentation or reach out to us at the community slack channel.
Join the slack community to know more about distributed tracing, observability, or SigNoz and to connect with other users and contributors.
If you have any ideas, questions, or any feedback, please share on our Github Discussions


