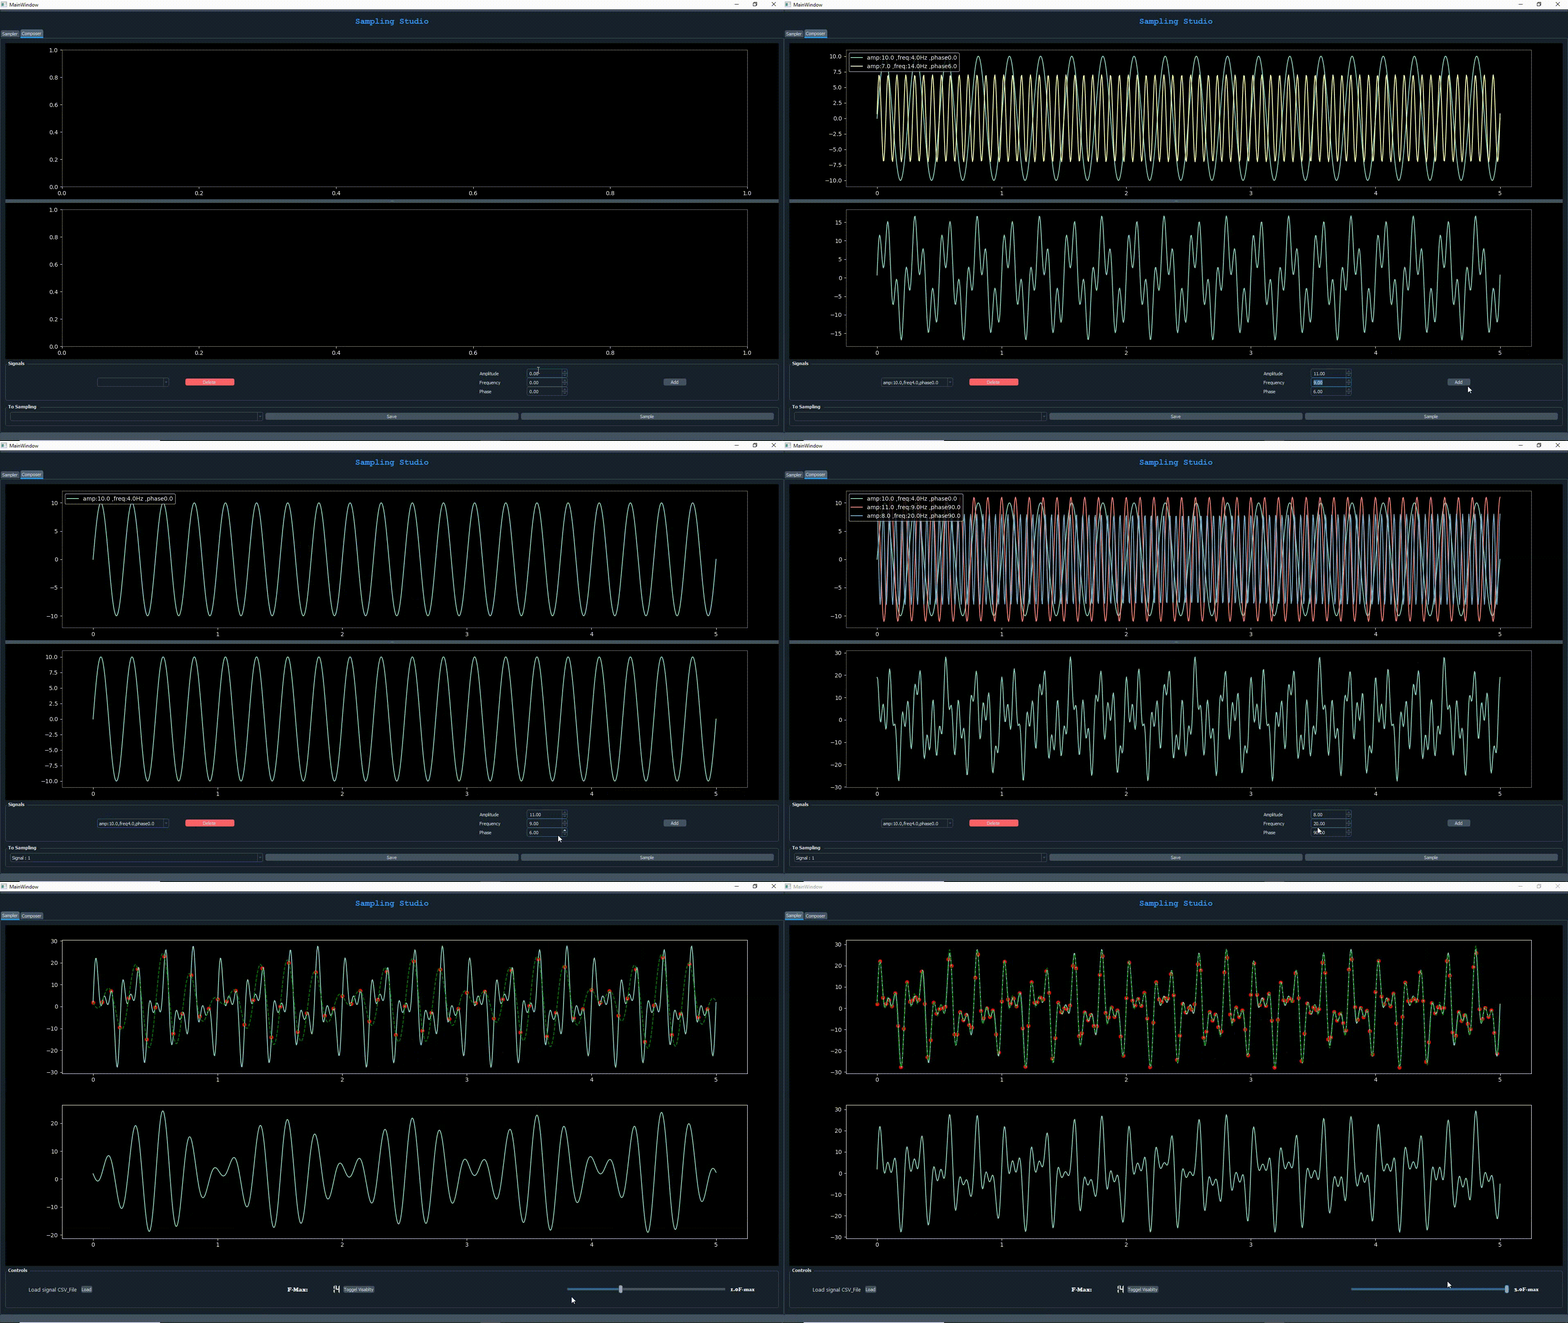
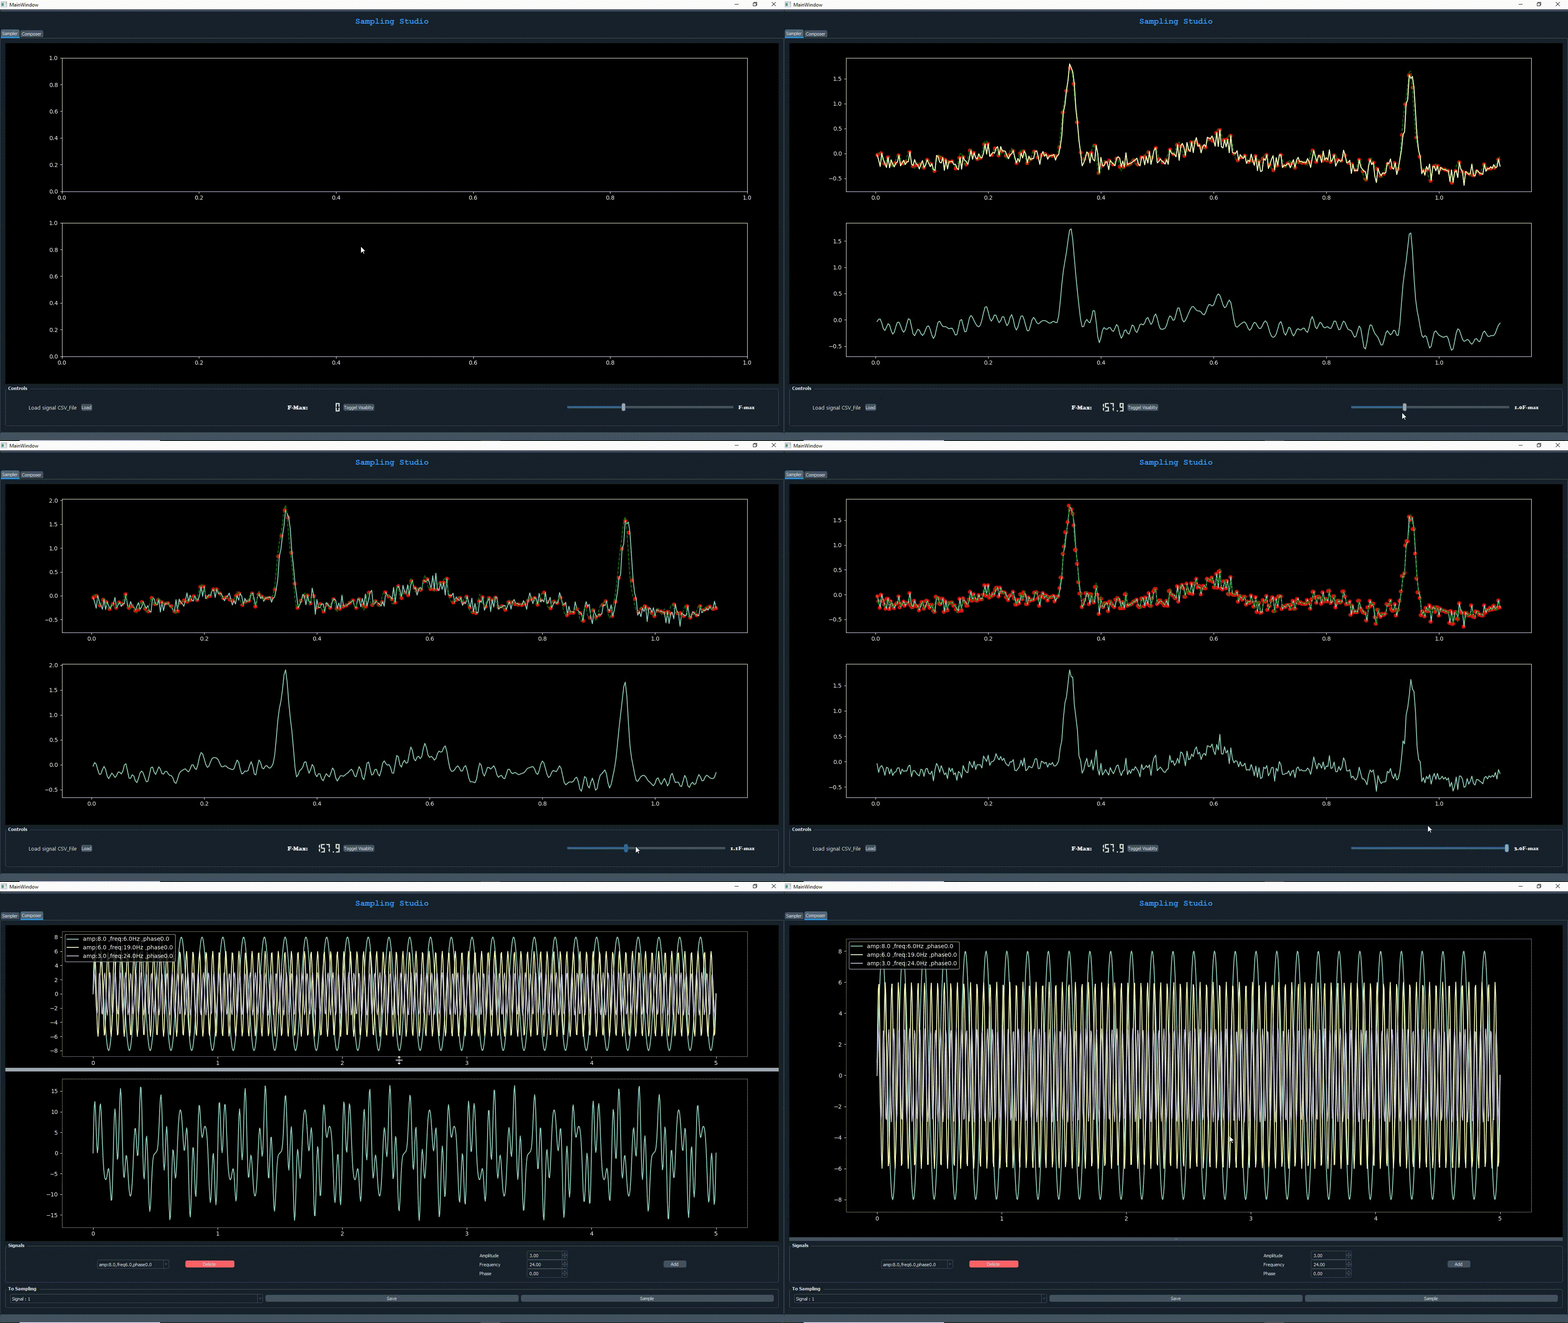
- Developing an illustrator for the signal recovery that shows Nyquist rate.
- read csv signal and see the sampled points highlighted on top of the signal.
- Change the sampling rate via a slider that range from 0 Hz to 3f max
- Reconstruct/recover the signal from the sampled points.
- Application has a Composer to generate basic signals to test and validate on the app
- One graph to display the sinusoidal to be generated
- One graph to display the sum of the generated sinusoidals.
- A combobox to select one of the contributing sinusoidals and remove it via a delete button.
- After making a synthetic signal then moving it to the main illustrator graph to start the sampling/recovery process.


- install project dependencies
pip install -r requirements.txt
- Run the application

