An example of an 'Doing Bayesian Data Analysis' (DBDA)-style diagram for hierarchical models, the classic "rats" example from BUGS, motivated by John K. Kruschke's post.
The Code is written in LaTeX and TikZ and uses 'distrograms' (pictograms of the distributions, a word-creation of Rasmus Bååth) to illustrate the underlying distributions.
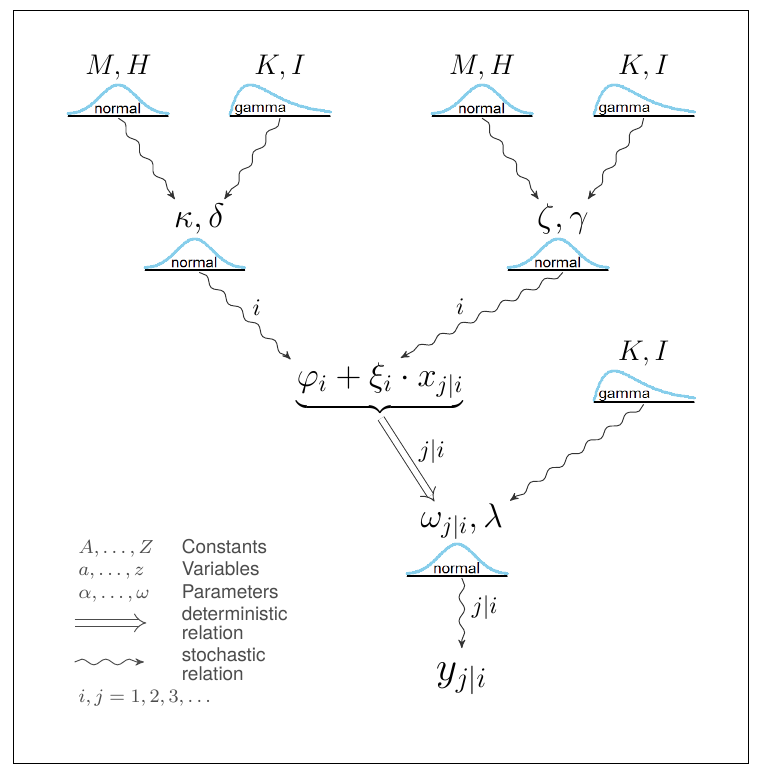
- hierarch_diagram.tex: The diagram, it is written in LaTeX and TikZ
- hierarch_diagram_framedBoxes.tex: In this example the nodes are framed to show the possibilities of TikZ
- plot_PNGs_of_MiniPlots.R: An R-script that draws the 'distrograms' of different distributions (Normal, Gamma, Beta). They are saved in
MiniPlots/.

John K. Kruschke motivated me to refactor the first prototype.
Rasmus Bååth wrote a sophisticated R-script to draw 'distrograms' for many different distributions and save them as .png and .svg. His code is on GitHub. I used his 'Normal' and 'Gamma' with some minor changes. He also created templates of the 'distrograms' for LibreOffice Draw, see his blog post.