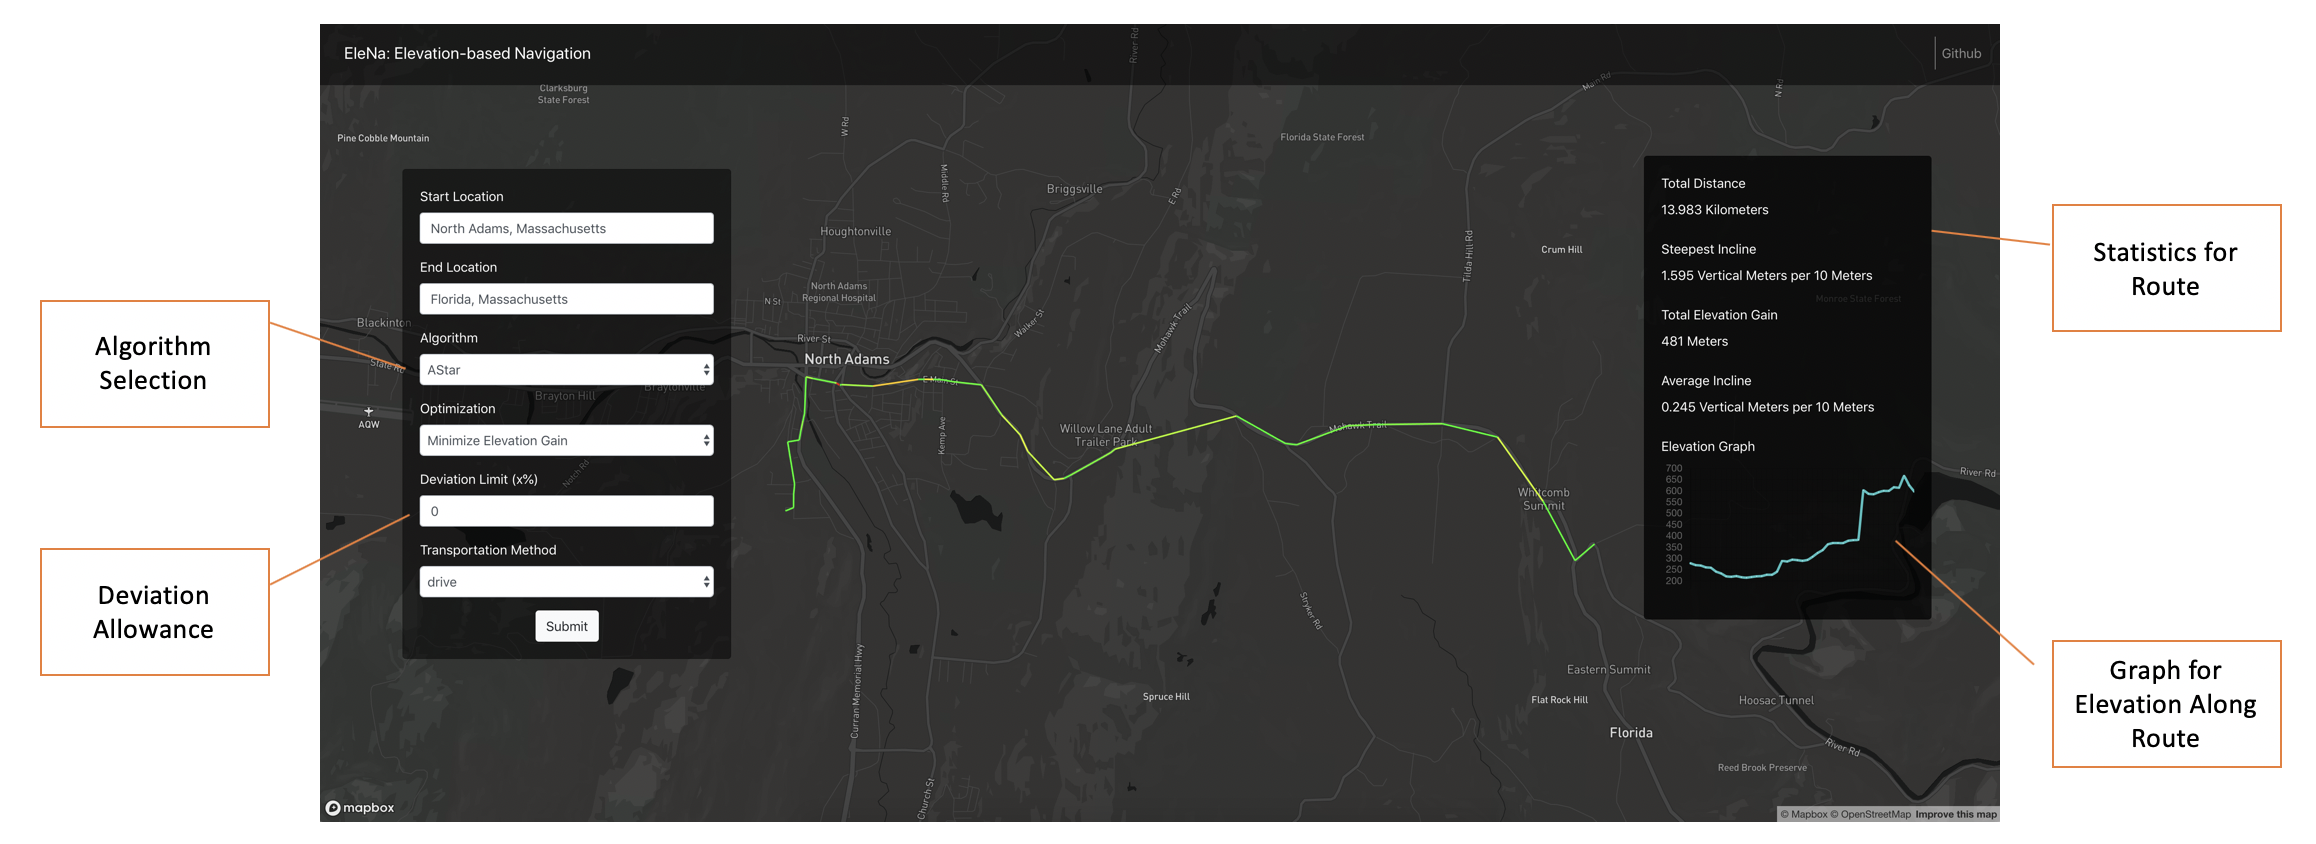
EleNa (Elevation-based Navigation) is a routing software that calculates routes based on your preference of route elevation. For example, if you wanted to get from the base of a hill to the top on a bicycle, standard shortest-path routes would make you take the steepest (but shortest) path up the hill. EleNa offers more control over the routing process, by allowing you to decide whether you want to take an easy route.
In order to run Project Elena, install the required python dependencies using pip install -r requirements.txt in the backend/src directory.
- The following dependencies are needed to run EleNa:
- osmnx
- networkx
You must also run the download-graphs.sh script in the root of the project to download the required graph cache files. Alternatively, you can also download it here- cached-graphs.zip, unzip the file, and place all 3 pickle files in the backend/data directory.
Once dependencies have finished installing and you download the cached graphs, navigate to the backend/src directory and run flask run to start the backend server. The backend server serves both the api for EleNa's processing and the frontend of the webapp.
The frontend for EleNa is a React app. If wish to run the frontend individually in dev mode, you need to go to the frontend directory, then install the dependencies and run the React app. You can use the following commands to do so-
yarn install
yarn start
Once the development server has started, the webapp development version will open in your default browser.
Note: If you wish to build the latest version of the frontend and run it with the Flask app, simply run the build-frontend.sh script from the root of the directory.
Figure 1. The Elena Webapp Graphical User Interface
Elena includes a host of features that allow for maximum end user control. These include:
- Algorithm choice: Choose between A Star, Breadth First Search, or Dijkstra Search for your routing algorithm
- Note: Breadth First Search does not allow for elevation preferences, as it will simply find a short path to your destination
- Control over the route through 4 preferences:
- Maximum/Minimum Steepness: Finds a route with the highest/lowest average grade (steepness) along your path
- Maximum/Minimum Elevation: Finds a route with the highest/lowest elevation changes in between nodes
- Deviation Limit: Choose how much you would like to deviate from the shortest path to match your route preference
- A deviation limit of < 5% will just give you the shortest path!
- 3 Choices for Transportation Method:
- Drive
- Bike
- Walk
- A colored route that shows you the parts of the route with steepest ascent (colored in red)
Just input a start destination and end destination and generate your route with your preferences
To get rough performance measures, we measured the runtime in seconds for 3 pairs of locations in the Boston Area. The values were averaged over 5 trials.
Shortest Path Runtime Comparison
| Algorithm | Dijkstra's | A* | BFS |
|---|---|---|---|
| Shortest Path | 1.00 | 1.61 | 9.48 |
The chart is normalized to the smallest runtime. The chart shows us how much slower A* and BFS run compared to Dijkstra's to get the shortest path. BFS can run slower than Dijkstra's if the number of nodes between the start end the end point are large. Since Dijkstra's is using a priority queue, it is better able to filter the shortest paths. A* ran very similar to Dijkstra's. It's possible that there is a more optimal heuristic that would bring the runtime down.
Elevation Algorithm Runtime Compared to Shortest Path Runtime
| Algorithm | Dijkstra's | A* |
|---|---|---|
| Minimum Elevation Change | 15.19 | 20.31 |
| Maximum Elevation Change | 1.46 | 1.42 |
Here we can see that the minimum elevation algorithm runs 15 time slower compared to the shortest path algorithm for Dijkstra, adn 20 times slower for A*. The maximum elevation time algorithm runs much faster than the minimum elevation algorithm.
Algorithm Runtime of A* compared to Dijkstra's
| Algorithm | Dijkstra's | A* |
|---|---|---|
| Shortest Path | 1.00 | 1.64 |
| Minimize Elevation Change | 1.00 | 2.11 |
| Maximize Elevation Change | 1.00 | 1.48 |
| Minimize Grade | 1.00 | 2.51 |
| Maximize Grade | 1.00 | 1.53 |
This chart is normalized compared to Dijkstra's runtime. It shows us how much better Dijkstra's Algorithm performed better than the A* Algorithm in terms of runtime. We can see that Dijkstra's had faster runtimes to minimize the elevation using elevation change and grade compared to A*. Maximizing the elevation took slightly longer compared to minimizing.
To run the test suite for the frontend, simply run yarn test in the frontend/ directory.
